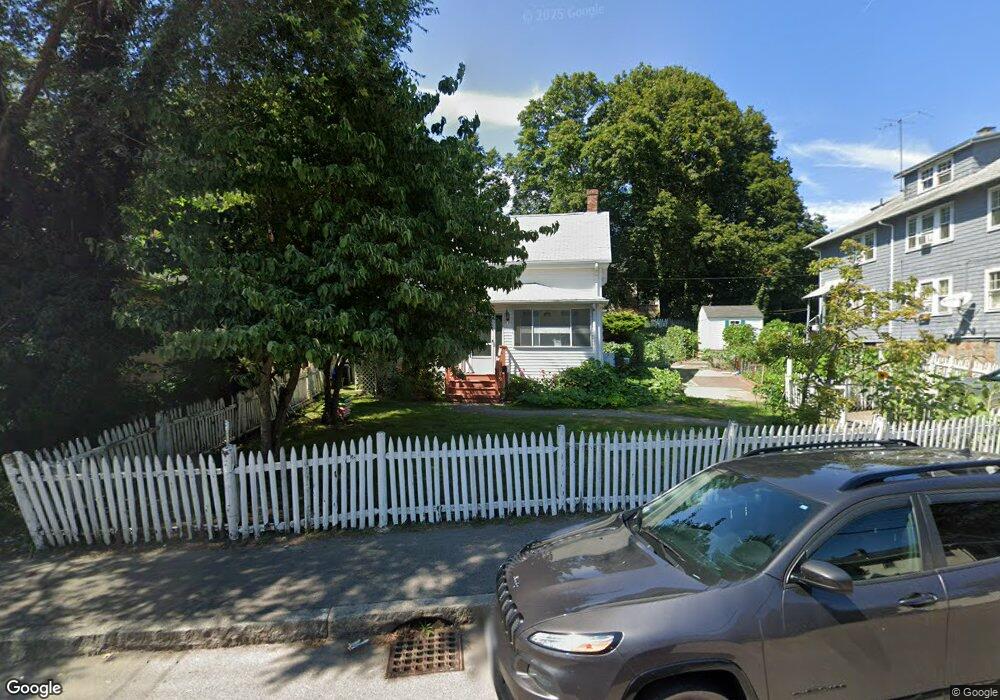
29 Garfield St Quincy, MA 02169
South Quincy NeighborhoodEstimated Value: $556,000 - $619,000
3
Beds
1
Bath
1,131
Sq Ft
$520/Sq Ft
Est. Value
About This Home
This home is located at 29 Garfield St, Quincy, MA 02169 and is currently estimated at $587,586, approximately $519 per square foot. 29 Garfield St is a home located in Norfolk County with nearby schools including Lincoln-Hancock Community School, South West Middle School, and Quincy High School.
Ownership History
Date
Name
Owned For
Owner Type
Purchase Details
Closed on
Jul 16, 2024
Sold by
Zhu Wo B and Chen Yu Y
Bought by
Zhu Miao N and Zhu Feng N
Current Estimated Value
Purchase Details
Closed on
Jul 30, 1997
Sold by
Seiser Alexa
Bought by
Zhu Wo B
Home Financials for this Owner
Home Financials are based on the most recent Mortgage that was taken out on this home.
Original Mortgage
$70,000
Interest Rate
7.55%
Mortgage Type
Purchase Money Mortgage
Create a Home Valuation Report for This Property
The Home Valuation Report is an in-depth analysis detailing your home's value as well as a comparison with similar homes in the area
Home Values in the Area
Average Home Value in this Area
Purchase History
| Date | Buyer | Sale Price | Title Company |
|---|---|---|---|
| Zhu Miao N | -- | None Available | |
| Zhu Miao N | -- | None Available | |
| Zhu Wo B | $125,000 | -- | |
| Zhu Wo B | $125,000 | -- |
Source: Public Records
Mortgage History
| Date | Status | Borrower | Loan Amount |
|---|---|---|---|
| Previous Owner | Zhu Wo B | $70,000 | |
| Previous Owner | Zhu Wo B | $96,000 |
Source: Public Records
Tax History Compared to Growth
Tax History
| Year | Tax Paid | Tax Assessment Tax Assessment Total Assessment is a certain percentage of the fair market value that is determined by local assessors to be the total taxable value of land and additions on the property. | Land | Improvement |
|---|---|---|---|---|
| 2025 | $6,080 | $527,300 | $297,300 | $230,000 |
| 2024 | $5,686 | $504,500 | $283,100 | $221,400 |
| 2023 | $5,202 | $467,400 | $257,400 | $210,000 |
| 2022 | $5,011 | $418,300 | $214,500 | $203,800 |
| 2021 | $4,803 | $395,600 | $214,500 | $181,100 |
| 2020 | $4,707 | $378,700 | $214,500 | $164,200 |
| 2019 | $4,567 | $363,900 | $202,300 | $161,600 |
| 2018 | $4,321 | $323,900 | $187,400 | $136,500 |
| 2017 | $4,318 | $304,700 | $178,400 | $126,300 |
| 2016 | $3,925 | $273,300 | $155,200 | $118,100 |
| 2015 | $3,840 | $263,000 | $155,200 | $107,800 |
| 2014 | $3,761 | $253,100 | $155,200 | $97,900 |
Source: Public Records
Map
Nearby Homes
- 64 Garfield St Unit B
- 51 Brook Rd
- 91 Garfield St
- 94 Brook Rd Unit 3
- 76 Scotch Pond Place Unit 76
- 21 Arthur St
- 118 Brook Rd Unit 2
- 12 Arthur Ave
- 73 Scotch Pond Place
- 14 Arthur Ave
- 8 Jackson St Unit B2
- 46 Suomi Rd
- 46 Suomi Rd Unit 46
- 46-48 Buckley St
- 57 Buckley St
- 56 Penn St Unit 4
- 50 N Payne St Unit 1
- 50 N Payne St Unit 3
- 1 Cityview Ln Unit 506
- 1 Cityview Ln Unit 709
- 33 Garfield St
- 23 Garfield St
- 50 Quarry St
- 35 Garfield St
- 21 Garfield St Unit 2
- 19 Garfield St
- 19 Garfield St Unit 1
- 26 Garfield St
- 40 Quarry St
- 39 Garfield St
- 42 Quarry St Unit 1
- 42 Quarry St
- 26 Kidder St
- 44 Quarry St Unit 2
- 15 Garfield St
- 38 Quarry St
- 28 Kidder St Unit Upper
- 28 Kidder St
- 28 Kidder St Unit 1
- 36 Garfield St