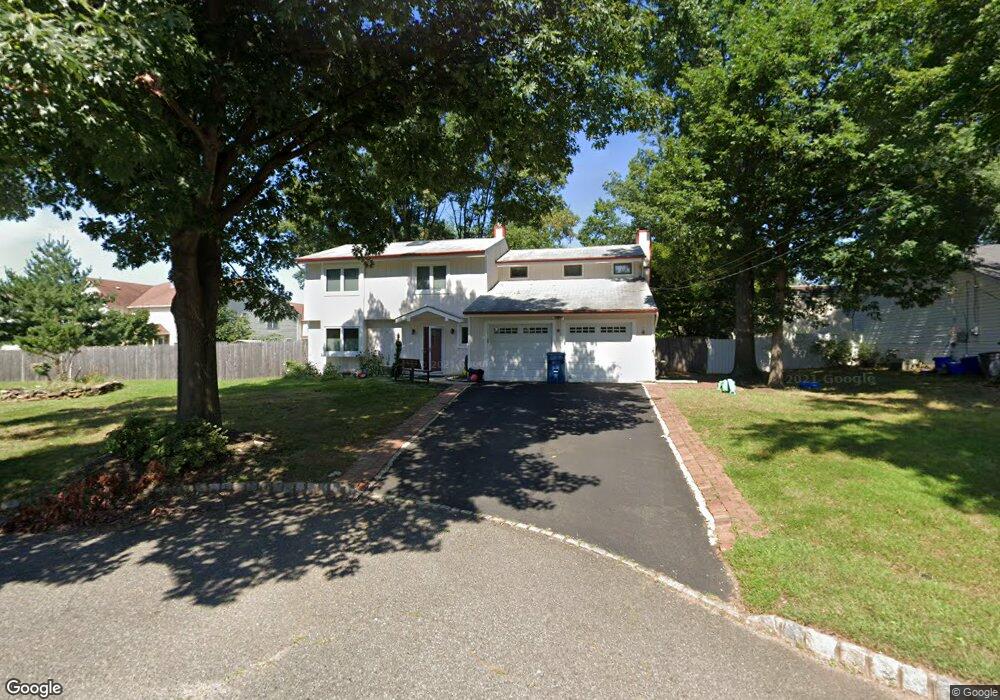
29 Gibson St Piscataway, NJ 08854
Estimated Value: $702,000 - $751,000
--
Bed
--
Bath
1,972
Sq Ft
$370/Sq Ft
Est. Value
About This Home
This home is located at 29 Gibson St, Piscataway, NJ 08854 and is currently estimated at $730,242, approximately $370 per square foot. 29 Gibson St is a home located in Middlesex County with nearby schools including Grandview Elementary School, Arbor Intermediate School, and Theodore Schor Middle School.
Ownership History
Date
Name
Owned For
Owner Type
Purchase Details
Closed on
Aug 9, 2005
Sold by
Washington Mutual Ban Kfa
Bought by
Awad Amira and Youssif Awad
Current Estimated Value
Purchase Details
Closed on
Oct 31, 2003
Sold by
Zhengming Lee
Bought by
Tang Chuan F
Purchase Details
Closed on
Feb 7, 2003
Sold by
Reyes Robert
Bought by
Zhengmin Lee
Home Financials for this Owner
Home Financials are based on the most recent Mortgage that was taken out on this home.
Original Mortgage
$346,750
Interest Rate
5.82%
Create a Home Valuation Report for This Property
The Home Valuation Report is an in-depth analysis detailing your home's value as well as a comparison with similar homes in the area
Home Values in the Area
Average Home Value in this Area
Purchase History
| Date | Buyer | Sale Price | Title Company |
|---|---|---|---|
| Awad Amira | $419,000 | -- | |
| Tang Chuan F | $409,000 | -- | |
| Zhengmin Lee | $385,000 | -- |
Source: Public Records
Mortgage History
| Date | Status | Borrower | Loan Amount |
|---|---|---|---|
| Previous Owner | Zhengmin Lee | $346,750 |
Source: Public Records
Tax History Compared to Growth
Tax History
| Year | Tax Paid | Tax Assessment Tax Assessment Total Assessment is a certain percentage of the fair market value that is determined by local assessors to be the total taxable value of land and additions on the property. | Land | Improvement |
|---|---|---|---|---|
| 2025 | $10,457 | $588,100 | $303,300 | $284,800 |
| 2024 | $10,223 | $541,800 | $195,700 | $346,100 |
| 2023 | $10,223 | $494,800 | $195,700 | $299,100 |
| 2022 | $9,870 | $443,400 | $195,700 | $247,700 |
| 2021 | $9,667 | $417,200 | $195,700 | $221,500 |
| 2020 | $10,776 | $466,100 | $157,900 | $308,200 |
| 2019 | $7,786 | $330,900 | $157,900 | $173,000 |
| 2018 | $8,801 | $375,800 | $212,900 | $162,900 |
| 2017 | $8,269 | $305,000 | $147,900 | $157,100 |
| 2016 | $8,119 | $305,000 | $147,900 | $157,100 |
| 2015 | $7,997 | $305,000 | $147,900 | $157,100 |
| 2014 | $7,897 | $308,000 | $147,900 | $160,100 |
Source: Public Records
Map
Nearby Homes