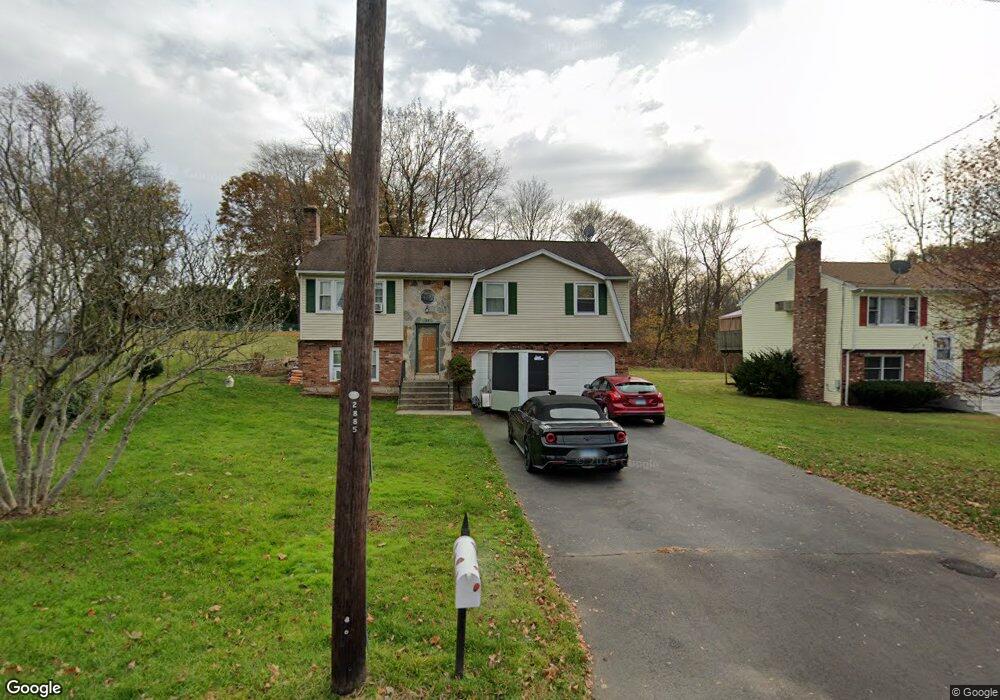
29 Gilman St East Hartford, CT 06108
Estimated Value: $313,000 - $341,000
3
Beds
3
Baths
1,138
Sq Ft
$286/Sq Ft
Est. Value
About This Home
This home is located at 29 Gilman St, East Hartford, CT 06108 and is currently estimated at $325,193, approximately $285 per square foot. 29 Gilman St is a home located in Hartford County with nearby schools including Anna E. Norris School, East Hartford Middle School, and East Hartford High School.
Ownership History
Date
Name
Owned For
Owner Type
Purchase Details
Closed on
Jul 25, 2013
Sold by
Oh Miyoung
Bought by
Burby Ki Y and Burby Francis
Current Estimated Value
Home Financials for this Owner
Home Financials are based on the most recent Mortgage that was taken out on this home.
Original Mortgage
$115,500
Outstanding Balance
$27,375
Interest Rate
3.97%
Estimated Equity
$297,818
Purchase Details
Closed on
Jan 8, 2003
Sold by
Choi Kwang S
Bought by
Oh Miyoung
Purchase Details
Closed on
Sep 30, 1988
Sold by
Pillion Robert F
Bought by
Choi Kwang S
Create a Home Valuation Report for This Property
The Home Valuation Report is an in-depth analysis detailing your home's value as well as a comparison with similar homes in the area
Home Values in the Area
Average Home Value in this Area
Purchase History
| Date | Buyer | Sale Price | Title Company |
|---|---|---|---|
| Burby Ki Y | $165,000 | -- | |
| Oh Miyoung | $100,000 | -- | |
| Choi Kwang S | $156,000 | -- |
Source: Public Records
Mortgage History
| Date | Status | Borrower | Loan Amount |
|---|---|---|---|
| Open | Choi Kwang S | $115,500 | |
| Previous Owner | Choi Kwang S | $20,000 | |
| Previous Owner | Choi Kwang S | $97,250 | |
| Previous Owner | Choi Kwang S | $100,000 |
Source: Public Records
Tax History Compared to Growth
Tax History
| Year | Tax Paid | Tax Assessment Tax Assessment Total Assessment is a certain percentage of the fair market value that is determined by local assessors to be the total taxable value of land and additions on the property. | Land | Improvement |
|---|---|---|---|---|
| 2025 | $7,267 | $158,320 | $40,640 | $117,680 |
| 2024 | $6,966 | $158,320 | $40,640 | $117,680 |
| 2023 | $6,735 | $158,320 | $40,640 | $117,680 |
| 2022 | $6,491 | $158,320 | $40,640 | $117,680 |
| 2021 | $6,088 | $123,360 | $34,210 | $89,150 |
| 2020 | $6,158 | $123,360 | $34,210 | $89,150 |
| 2019 | $6,058 | $123,360 | $34,210 | $89,150 |
| 2018 | $5,879 | $123,360 | $34,210 | $89,150 |
| 2017 | $5,804 | $123,360 | $34,210 | $89,150 |
| 2016 | $5,713 | $124,570 | $34,210 | $90,360 |
| 2015 | $5,713 | $124,570 | $34,210 | $90,360 |
| 2014 | $5,655 | $124,570 | $34,210 | $90,360 |
Source: Public Records
Map
Nearby Homes
- 39 Tiffany Rd
- 110 Goodwin St
- 50 Northbrook Ct
- 29 Joanne Dr Unit 29
- 67 Laurel St
- 51 Wood Dr
- 1589 Main St
- 22 Matthew Rd
- 89 Henderson Dr
- 15 Michael Ave
- 577 Goodwin St
- 51 Daniel St
- 453 Burnside Ave
- 80 Stanley St
- 421 Tolland St
- 265 Burnside Ave
- 506 Burnside Ave
- 181 Burnside Ave
- 10 Kenyon Place
- 509 Burnside Ave Unit A18