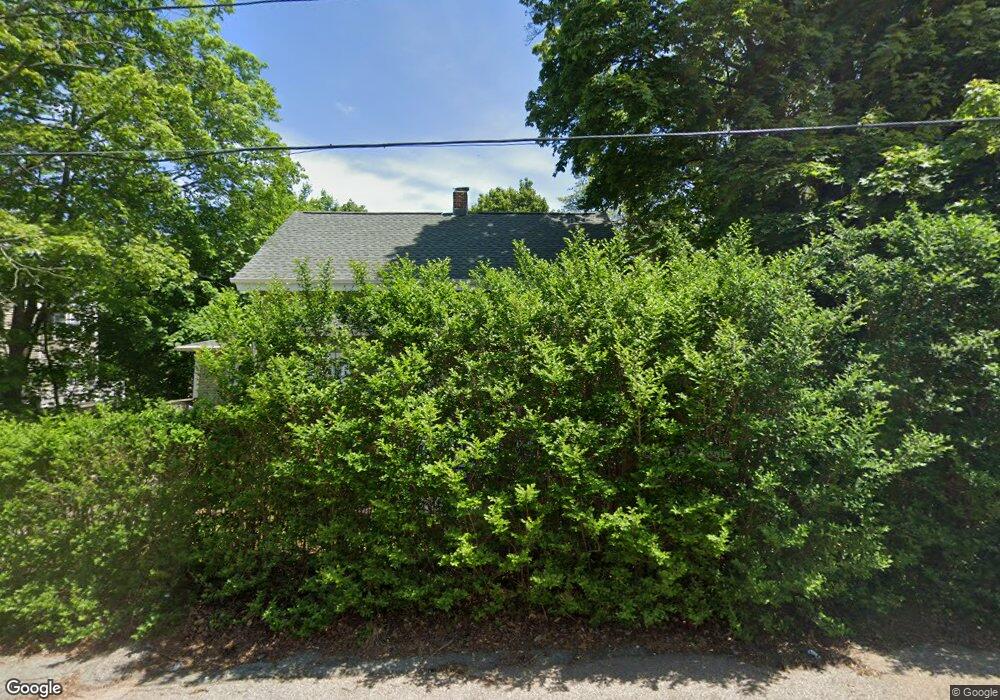
29 Greene St West Warwick, RI 02893
West Warwick Centre NeighborhoodEstimated Value: $353,000 - $424,000
3
Beds
1
Bath
1,246
Sq Ft
$309/Sq Ft
Est. Value
About This Home
This home is located at 29 Greene St, West Warwick, RI 02893 and is currently estimated at $384,664, approximately $308 per square foot. 29 Greene St is a home located in Kent County with nearby schools including West Warwick High School, Islamic School of Rhode Island, and St Joseph School.
Ownership History
Date
Name
Owned For
Owner Type
Purchase Details
Closed on
May 19, 2025
Sold by
West Warwick Town Of
Bought by
Rhode Is Hsng & Mtg Fin
Current Estimated Value
Purchase Details
Closed on
Apr 17, 1995
Sold by
Mccabe Rita C Est
Bought by
Hensley Eddie R and Hensley Frances
Home Financials for this Owner
Home Financials are based on the most recent Mortgage that was taken out on this home.
Original Mortgage
$81,450
Interest Rate
8.49%
Mortgage Type
Purchase Money Mortgage
Create a Home Valuation Report for This Property
The Home Valuation Report is an in-depth analysis detailing your home's value as well as a comparison with similar homes in the area
Home Values in the Area
Average Home Value in this Area
Purchase History
| Date | Buyer | Sale Price | Title Company |
|---|---|---|---|
| Rhode Is Hsng & Mtg Fin | $8,942 | None Available | |
| Rhode Is Hsng & Mtg Fin | $8,942 | None Available | |
| Hensley Eddie R | $80,000 | -- | |
| Hensley Eddie R | $80,000 | -- |
Source: Public Records
Mortgage History
| Date | Status | Borrower | Loan Amount |
|---|---|---|---|
| Previous Owner | Hensley Eddie R | $45,000 | |
| Previous Owner | Hensley Eddie R | $78,189 | |
| Previous Owner | Hensley Eddie R | $81,450 |
Source: Public Records
Tax History Compared to Growth
Tax History
| Year | Tax Paid | Tax Assessment Tax Assessment Total Assessment is a certain percentage of the fair market value that is determined by local assessors to be the total taxable value of land and additions on the property. | Land | Improvement |
|---|---|---|---|---|
| 2025 | $3,975 | $278,200 | $79,400 | $198,800 |
| 2024 | $3,893 | $208,300 | $64,100 | $144,200 |
| 2023 | $3,816 | $208,300 | $64,100 | $144,200 |
| 2022 | $3,758 | $208,300 | $64,100 | $144,200 |
| 2021 | $3,919 | $170,400 | $51,300 | $119,100 |
| 2020 | $3,919 | $170,400 | $51,300 | $119,100 |
| 2019 | $4,996 | $170,400 | $51,300 | $119,100 |
| 2018 | $3,294 | $121,200 | $46,100 | $75,100 |
| 2017 | $3,189 | $121,200 | $46,100 | $75,100 |
| 2016 | $3,132 | $121,200 | $46,100 | $75,100 |
| 2015 | $2,775 | $106,900 | $46,100 | $60,800 |
| 2014 | $2,714 | $106,900 | $46,100 | $60,800 |
Source: Public Records
Map
Nearby Homes