Estimated Value: $256,000 - $318,000
2
Beds
1
Bath
1,909
Sq Ft
$147/Sq Ft
Est. Value
About This Home
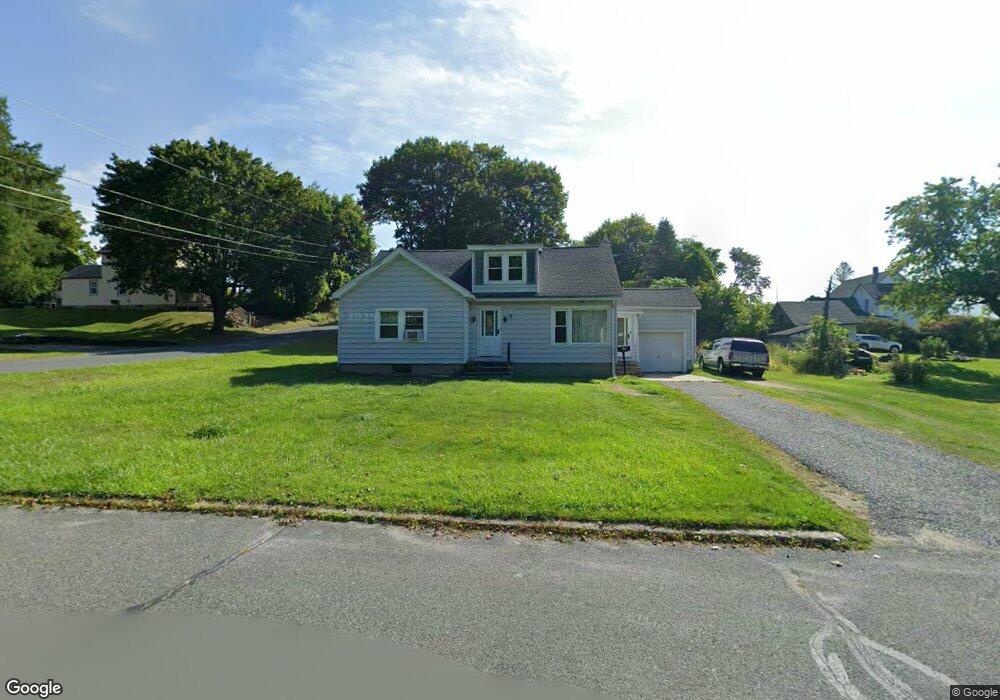
This home is located at 29 Greylock Ave, Adams, MA 01220 and is currently estimated at $279,717, approximately $146 per square foot. 29 Greylock Ave is a home located in Berkshire County with nearby schools including Hoosac Valley Middle & High School, Berkshire Arts & Technology Charter Public School, and St. Stanislaus Kostka School.
Ownership History
Date
Name
Owned For
Owner Type
Purchase Details
Closed on
Apr 28, 2011
Sold by
Duda Michael T
Bought by
Peck Jaems E
Current Estimated Value
Home Financials for this Owner
Home Financials are based on the most recent Mortgage that was taken out on this home.
Original Mortgage
$6,500
Outstanding Balance
$3,699
Interest Rate
4.63%
Estimated Equity
$276,018
Create a Home Valuation Report for This Property
The Home Valuation Report is an in-depth analysis detailing your home's value as well as a comparison with similar homes in the area
Home Values in the Area
Average Home Value in this Area
Purchase History
| Date | Buyer | Sale Price | Title Company |
|---|---|---|---|
| Peck Jaems E | $125,000 | -- |
Source: Public Records
Mortgage History
| Date | Status | Borrower | Loan Amount |
|---|---|---|---|
| Open | Peck Jaems E | $6,500 | |
| Open | Peck Jaems E | $115,000 |
Source: Public Records
Tax History Compared to Growth
Tax History
| Year | Tax Paid | Tax Assessment Tax Assessment Total Assessment is a certain percentage of the fair market value that is determined by local assessors to be the total taxable value of land and additions on the property. | Land | Improvement |
|---|---|---|---|---|
| 2025 | $3,834 | $225,400 | $55,600 | $169,800 |
| 2024 | $3,619 | $206,300 | $52,300 | $154,000 |
| 2023 | $3,371 | $181,700 | $47,500 | $134,200 |
| 2022 | $3,284 | $157,200 | $41,300 | $115,900 |
| 2021 | $3,407 | $142,400 | $41,300 | $101,100 |
| 2020 | $4,131 | $142,100 | $41,900 | $100,200 |
| 2019 | $3,040 | $142,100 | $41,900 | $100,200 |
| 2018 | $3,116 | $140,300 | $41,900 | $98,400 |
| 2017 | $2,998 | $140,300 | $41,900 | $98,400 |
| 2016 | $2,751 | $128,600 | $41,900 | $86,700 |
| 2015 | $2,699 | $126,300 | $43,800 | $82,500 |
| 2014 | $2,520 | $126,300 | $43,800 | $82,500 |
Source: Public Records
Map
Nearby Homes