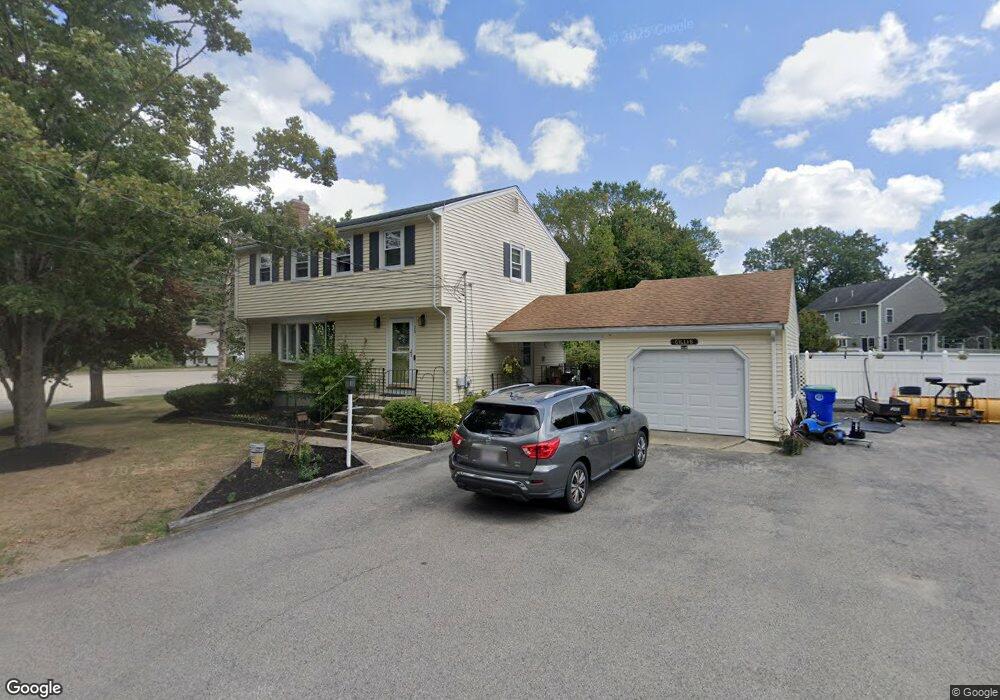
29 Harlow Rd Rockland, MA 02370
Estimated Value: $580,000 - $652,461
4
Beds
3
Baths
1,568
Sq Ft
$394/Sq Ft
Est. Value
About This Home
This home is located at 29 Harlow Rd, Rockland, MA 02370 and is currently estimated at $617,115, approximately $393 per square foot. 29 Harlow Rd is a home located in Plymouth County with nearby schools including Rockland Senior High School, St Bridget School, and Calvary Chapel Academy.
Ownership History
Date
Name
Owned For
Owner Type
Purchase Details
Closed on
Aug 24, 2018
Sold by
Kib Ret
Bought by
Gillis Denise E and Gillis Steven E
Current Estimated Value
Home Financials for this Owner
Home Financials are based on the most recent Mortgage that was taken out on this home.
Original Mortgage
$382,500
Interest Rate
4.5%
Mortgage Type
New Conventional
Purchase Details
Closed on
Sep 30, 2011
Sold by
Benson Geraldine
Bought by
Kib Ret
Create a Home Valuation Report for This Property
The Home Valuation Report is an in-depth analysis detailing your home's value as well as a comparison with similar homes in the area
Home Values in the Area
Average Home Value in this Area
Purchase History
| Date | Buyer | Sale Price | Title Company |
|---|---|---|---|
| Gillis Denise E | $425,000 | -- | |
| Kib Ret | $266,000 | -- |
Source: Public Records
Mortgage History
| Date | Status | Borrower | Loan Amount |
|---|---|---|---|
| Previous Owner | Gillis Denise E | $382,500 |
Source: Public Records
Tax History Compared to Growth
Tax History
| Year | Tax Paid | Tax Assessment Tax Assessment Total Assessment is a certain percentage of the fair market value that is determined by local assessors to be the total taxable value of land and additions on the property. | Land | Improvement |
|---|---|---|---|---|
| 2025 | $7,658 | $560,200 | $229,200 | $331,000 |
| 2024 | $7,488 | $532,600 | $216,200 | $316,400 |
| 2023 | $7,452 | $489,600 | $198,300 | $291,300 |
| 2022 | $7,201 | $429,900 | $172,400 | $257,500 |
| 2021 | $6,791 | $393,000 | $156,800 | $236,200 |
| 2020 | $6,563 | $375,000 | $149,300 | $225,700 |
| 2019 | $6,460 | $360,500 | $142,200 | $218,300 |
| 2018 | $5,932 | $325,600 | $142,200 | $183,400 |
| 2017 | $5,738 | $310,500 | $142,200 | $168,300 |
| 2016 | $5,554 | $300,400 | $136,800 | $163,600 |
| 2015 | $5,315 | $279,300 | $127,800 | $151,500 |
| 2014 | $5,029 | $274,200 | $125,300 | $148,900 |
Source: Public Records
Map
Nearby Homes
- 133 Spring St
- 17 Pat Rose Way
- 20 Pat Rose Way
- 14 Daniel Teague Dr
- 8 Pat Rose Way
- 6 Pat Rose Way
- 19 Pat Rose Way
- 810 Brookline Way
- 149 Concord St
- 137 Peregrine Rd
- 158 Central St
- 800 Plymouth St
- 696 Summer St
- 60 Fairview St
- 225 W Water St
- 140 W Water St
- 94-96 Crescent St
- 133 Crescent St
- 38 Levin Rd
- 440 Market St