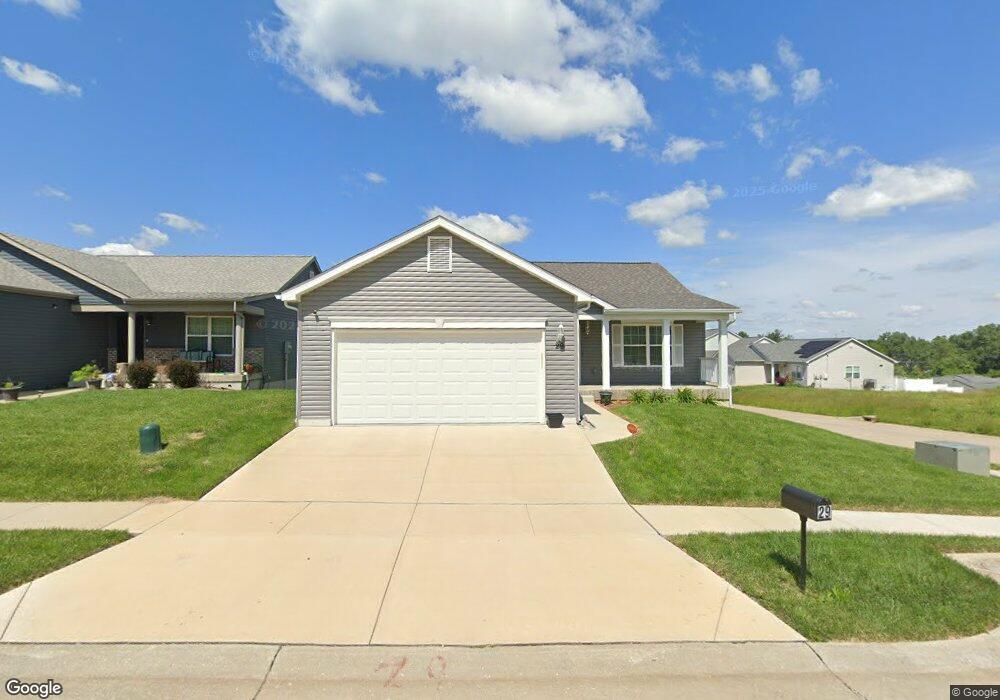
29 Hensley Terrace Jennings, MO 63136
Estimated Value: $158,000 - $272,000
3
Beds
3
Baths
1,300
Sq Ft
$161/Sq Ft
Est. Value
About This Home
This home is located at 29 Hensley Terrace, Jennings, MO 63136 and is currently estimated at $208,667, approximately $160 per square foot. 29 Hensley Terrace is a home located in St. Louis County with nearby schools including Jennings Junior High School, Jennings High School, and St. Louis Unified School.
Ownership History
Date
Name
Owned For
Owner Type
Purchase Details
Closed on
Aug 14, 2023
Sold by
A Caring Plus Incorporated
Bought by
Yates Marva
Current Estimated Value
Home Financials for this Owner
Home Financials are based on the most recent Mortgage that was taken out on this home.
Original Mortgage
$108,000
Outstanding Balance
$105,539
Interest Rate
6.81%
Mortgage Type
New Conventional
Estimated Equity
$103,128
Purchase Details
Closed on
Jan 7, 2022
Sold by
Caring Plus Foundation
Bought by
A Caring Plus Foundation
Home Financials for this Owner
Home Financials are based on the most recent Mortgage that was taken out on this home.
Original Mortgage
$466,275
Interest Rate
3.22%
Purchase Details
Closed on
Nov 6, 2015
Sold by
Nile Valley Llc
Bought by
A Caring Plus Foundation
Create a Home Valuation Report for This Property
The Home Valuation Report is an in-depth analysis detailing your home's value as well as a comparison with similar homes in the area
Home Values in the Area
Average Home Value in this Area
Purchase History
| Date | Buyer | Sale Price | Title Company |
|---|---|---|---|
| Yates Marva | -- | None Listed On Document | |
| A Caring Plus Foundation | -- | Security Title | |
| A Caring Plus Foundation | $410,000 | Security Title Ins Agency Cm |
Source: Public Records
Mortgage History
| Date | Status | Borrower | Loan Amount |
|---|---|---|---|
| Open | Yates Marva | $108,000 | |
| Previous Owner | A Caring Plus Foundation | $466,275 |
Source: Public Records
Tax History Compared to Growth
Tax History
| Year | Tax Paid | Tax Assessment Tax Assessment Total Assessment is a certain percentage of the fair market value that is determined by local assessors to be the total taxable value of land and additions on the property. | Land | Improvement |
|---|---|---|---|---|
| 2025 | $2,898 | $32,820 | $1,180 | $31,640 |
| 2024 | $2,898 | $27,780 | $1,180 | $26,600 |
| 2023 | $122 | $1,180 | $1,180 | $0 |
| 2022 | $201 | $1,580 | $1,580 | $0 |
| 2021 | $198 | $1,580 | $1,580 | $0 |
| 2020 | $353 | $2,680 | $2,680 | $0 |
| 2019 | $343 | $2,680 | $2,680 | $0 |
| 2018 | $217 | $1,620 | $1,620 | $0 |
| 2017 | $210 | $1,620 | $1,620 | $0 |
| 2016 | $99 | $760 | $760 | $0 |
| 2015 | $99 | $760 | $760 | $0 |
| 2014 | $202 | $1,540 | $1,540 | $0 |
Source: Public Records
Map
Nearby Homes
- 9213 Ranch Meadows Dr
- 9456 Dawn Ct
- 2568 Dorwood Dr
- 9435 Eastchester Dr
- 9418 Pattonwood Dr
- 9422 Westchester Dr
- 9343 Duenke Dr
- 8912 Boyce Place
- 2035 Sun Valley Dr
- 9419 Jennings Station Rd
- 9427 Yorktown Dr
- 9472 Yorktown Dr
- 2456 Wieck Dr
- 2367 Collett Dr
- 9539 Marveline Dr
- 1119 Astoria Dr
- 1141 Saint Cyr Rd
- 9299 Lucas and Hunt Rd
- 1118 Dunford Dr
- 1236 Duenke Dr
- 25 Hensley Terrace
- 24 Hensley Terrace
- 87 Robinson Cir
- 44 Robinson Cir
- 28 Hensley Terrace
- 40 Robinson Cir
- 40 Robinson Circle Dr
- 20 Hensley Terrace
- 99 Robinson Circle Dr
- 11 Hensley Terrace
- 71 Robinson Circle Dr
- 9 Hensley Terrace
- 7 Hensley Terrace
- 67 Robinson Circle Dr
- 5 Hensley Terrace
- 1 Hensley Terrace
- 3 Hensley Terrace
- 41 Robinson Circle Dr
- 0 Unknown Unit 17054565
- 0 Unknown Unit 17054561