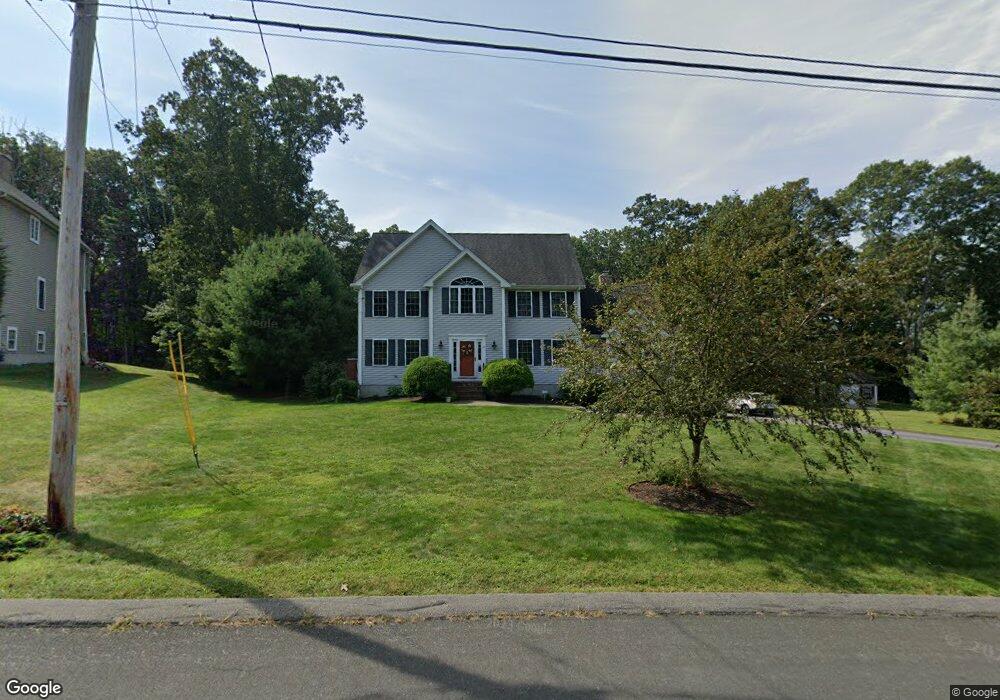
29 Highridge Rd Bellingham, MA 02019
Estimated Value: $871,872 - $945,000
4
Beds
3
Baths
3,116
Sq Ft
$292/Sq Ft
Est. Value
About This Home
This home is located at 29 Highridge Rd, Bellingham, MA 02019 and is currently estimated at $910,968, approximately $292 per square foot. 29 Highridge Rd is a home located in Norfolk County with nearby schools including Joseph F. DiPietro Elementary, Bellingham High School, and Rise Prep Mayoral Academy Middle School.
Ownership History
Date
Name
Owned For
Owner Type
Purchase Details
Closed on
Sep 21, 2005
Sold by
Narducci Corp
Bought by
Paturzo Elliott J and Paturzo Susan
Current Estimated Value
Home Financials for this Owner
Home Financials are based on the most recent Mortgage that was taken out on this home.
Original Mortgage
$350,000
Outstanding Balance
$188,074
Interest Rate
5.92%
Mortgage Type
Purchase Money Mortgage
Estimated Equity
$722,894
Create a Home Valuation Report for This Property
The Home Valuation Report is an in-depth analysis detailing your home's value as well as a comparison with similar homes in the area
Home Values in the Area
Average Home Value in this Area
Purchase History
| Date | Buyer | Sale Price | Title Company |
|---|---|---|---|
| Paturzo Elliott J | $525,000 | -- |
Source: Public Records
Mortgage History
| Date | Status | Borrower | Loan Amount |
|---|---|---|---|
| Open | Paturzo Elliott J | $350,000 |
Source: Public Records
Tax History
| Year | Tax Paid | Tax Assessment Tax Assessment Total Assessment is a certain percentage of the fair market value that is determined by local assessors to be the total taxable value of land and additions on the property. | Land | Improvement |
|---|---|---|---|---|
| 2025 | $9,237 | $735,400 | $183,900 | $551,500 |
| 2024 | $8,812 | $685,200 | $167,900 | $517,300 |
| 2023 | $8,489 | $650,500 | $159,900 | $490,600 |
| 2022 | $8,427 | $598,500 | $139,300 | $459,200 |
| 2021 | $8,088 | $561,300 | $139,300 | $422,000 |
| 2020 | $7,672 | $539,500 | $137,200 | $402,300 |
| 2019 | $7,494 | $527,400 | $137,200 | $390,200 |
| 2018 | $7,415 | $514,600 | $149,200 | $365,400 |
| 2017 | $7,171 | $500,100 | $149,200 | $350,900 |
| 2016 | $6,788 | $475,000 | $157,800 | $317,200 |
| 2015 | $6,762 | $474,500 | $157,800 | $316,700 |
| 2014 | $6,638 | $452,800 | $153,500 | $299,300 |
Source: Public Records
Map
Nearby Homes
- 8 Innsbruck Way
- 352 Lake St
- 900 Washington St Lot 2
- 22 Pine Warbler Way
- 4 Cypress Cir Unit 4
- 8 Cypress Cir Unit 8
- 25 Palmetto Dr Unit 25
- 21 Palmetto Dr Unit 21
- 23 Palmetto Dr Unit 23
- 24 Palmetto Dr Unit 24
- 241 Prospect St
- 66 Newland Ave
- 18 Bubbling Brook Rd
- 2 Spring St
- 1 Spring St
- 101 Pine Grove Ave
- 31 Lilac Ave
- 855 S Main St
- 25 Nature View Dr
- 2 Northern Lights Way
- 31 Highridge Rd
- 31 Highridge Rd Unit 31
- 27 Highridge Rd
- 34 Highridge Rd
- 34 Highridge Rd
- 36 Highridge Rd
- 33 Highridge Rd
- 32 Highridge Rd
- 36 Highridge Rd
- 38 Highridge Rd
- 30 Highridge Rd
- 35 Highridge Rd
- 25 Highridge Rd
- 40 Highridge Rd
- 29 Gemmur Ln
- 28 Highridge Rd
- 37 Highridge Rd
- 42 Highridge Rd
- 23 Highridge Rd
- 26 Highridge Rd
Your Personal Tour Guide
Ask me questions while you tour the home.