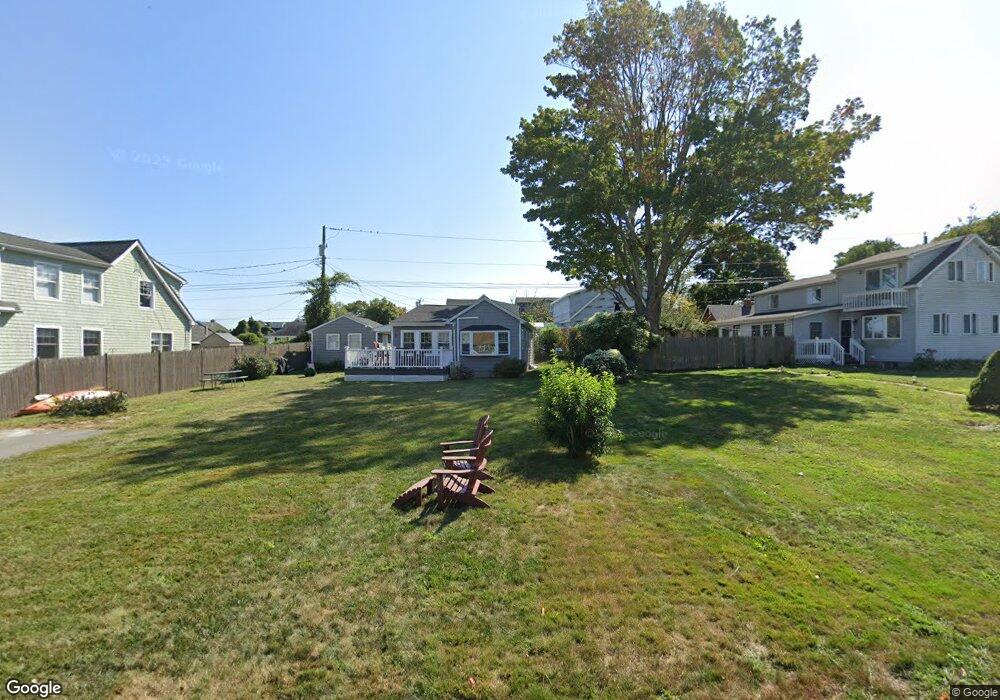
29 Hill St Old Saybrook, CT 06475
Estimated Value: $385,000 - $477,000
2
Beds
1
Bath
682
Sq Ft
$617/Sq Ft
Est. Value
About This Home
This home is located at 29 Hill St, Old Saybrook, CT 06475 and is currently estimated at $420,809, approximately $617 per square foot. 29 Hill St is a home located in Middlesex County with nearby schools including Kathleen E. Goodwin School, Old Saybrook Middle School, and Old Saybrook Senior High School.
Ownership History
Date
Name
Owned For
Owner Type
Purchase Details
Closed on
Apr 30, 2001
Sold by
Pasquale Corrine R
Bought by
Mckone Linda K
Current Estimated Value
Purchase Details
Closed on
Aug 18, 1997
Sold by
Peace Timothy and Peace Shelly A
Bought by
Pasquale Corinne R
Purchase Details
Closed on
Sep 14, 1994
Sold by
Peace Julie G
Bought by
Peace Timothy and Peace Shelly A
Purchase Details
Closed on
Nov 16, 1990
Sold by
Earles James B
Bought by
Moody Julie G
Create a Home Valuation Report for This Property
The Home Valuation Report is an in-depth analysis detailing your home's value as well as a comparison with similar homes in the area
Home Values in the Area
Average Home Value in this Area
Purchase History
| Date | Buyer | Sale Price | Title Company |
|---|---|---|---|
| Mckone Linda K | $130,000 | -- | |
| Pasquale Corinne R | $101,000 | -- | |
| Peace Timothy | $97,358 | -- | |
| Moody Julie G | $101,000 | -- |
Source: Public Records
Mortgage History
| Date | Status | Borrower | Loan Amount |
|---|---|---|---|
| Open | Moody Julie G | $83,156 | |
| Closed | Moody Julie G | $25,000 | |
| Closed | Moody Julie G | $104,000 |
Source: Public Records
Tax History Compared to Growth
Tax History
| Year | Tax Paid | Tax Assessment Tax Assessment Total Assessment is a certain percentage of the fair market value that is determined by local assessors to be the total taxable value of land and additions on the property. | Land | Improvement |
|---|---|---|---|---|
| 2025 | $3,061 | $197,500 | $93,900 | $103,600 |
| 2024 | $3,002 | $197,500 | $93,900 | $103,600 |
| 2023 | $2,990 | $146,200 | $74,500 | $71,700 |
| 2022 | $2,936 | $146,200 | $74,500 | $71,700 |
| 2021 | $2,931 | $146,200 | $74,500 | $71,700 |
| 2020 | $2,931 | $146,200 | $74,500 | $71,700 |
| 2019 | $2,834 | $143,500 | $74,500 | $69,000 |
| 2018 | $2,844 | $145,100 | $83,400 | $61,700 |
| 2017 | $2,853 | $145,100 | $83,400 | $61,700 |
| 2016 | $2,795 | $145,100 | $83,400 | $61,700 |
| 2015 | $2,729 | $145,100 | $83,400 | $61,700 |
| 2014 | $2,684 | $145,100 | $83,400 | $61,700 |
Source: Public Records
Map
Nearby Homes