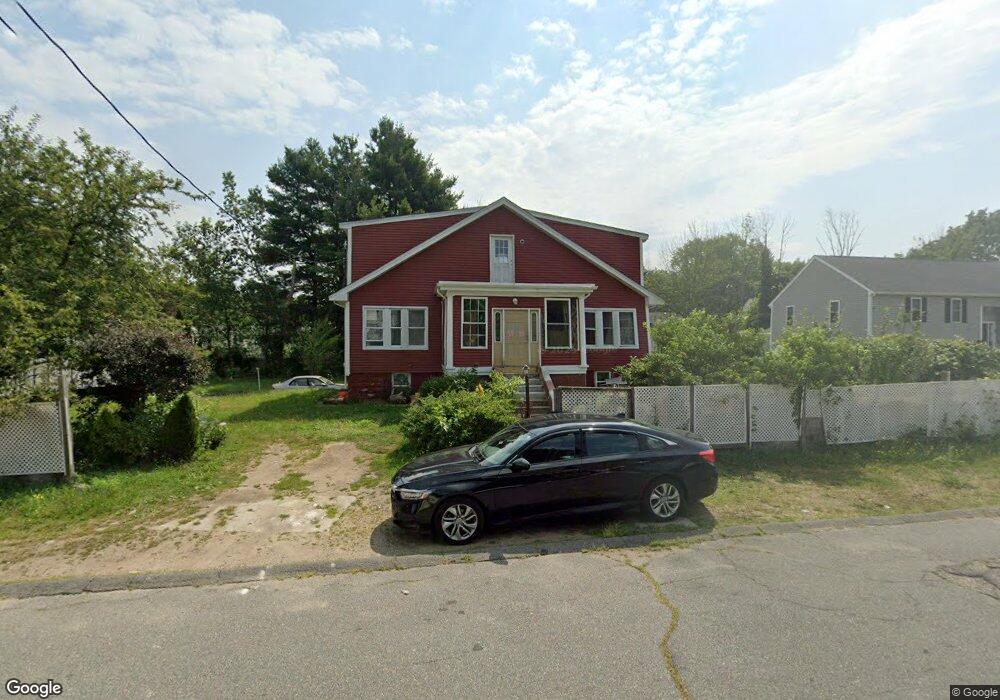
29 Howland St Brockton, MA 02302
Estimated Value: $553,000 - $671,000
4
Beds
2
Baths
2,528
Sq Ft
$244/Sq Ft
Est. Value
About This Home
This home is located at 29 Howland St, Brockton, MA 02302 and is currently estimated at $617,017, approximately $244 per square foot. 29 Howland St is a home located in Plymouth County with nearby schools including Brookfield Elementary School, Downey Elementary School, and Mary E. Baker Elementary School.
Ownership History
Date
Name
Owned For
Owner Type
Purchase Details
Closed on
May 2, 2001
Sold by
Jean-Pierre Louisanne
Bought by
Paul-Saint Robinson and Paul-Saint Joseph Magalie
Current Estimated Value
Purchase Details
Closed on
Jun 17, 1999
Sold by
Avila Margoth
Bought by
Jean-Pierre Louisanne
Purchase Details
Closed on
Dec 6, 1994
Sold by
Fhlmc
Bought by
Avila Victor H
Purchase Details
Closed on
Jul 9, 1992
Sold by
Comfed Sb Fa
Bought by
Fhlmc
Create a Home Valuation Report for This Property
The Home Valuation Report is an in-depth analysis detailing your home's value as well as a comparison with similar homes in the area
Home Values in the Area
Average Home Value in this Area
Purchase History
| Date | Buyer | Sale Price | Title Company |
|---|---|---|---|
| Paul-Saint Robinson | $171,000 | -- | |
| Paul-Saint Robinson | $171,000 | -- | |
| Jean-Pierre Louisanne | $137,000 | -- | |
| Jean-Pierre Louisanne | $137,000 | -- | |
| Avila Victor H | $37,500 | -- | |
| Fhlmc | $140,468 | -- |
Source: Public Records
Mortgage History
| Date | Status | Borrower | Loan Amount |
|---|---|---|---|
| Open | Fhlmc | $30,000 | |
| Open | Fhlmc | $45,000 | |
| Open | Fhlmc | $185,400 |
Source: Public Records
Tax History Compared to Growth
Tax History
| Year | Tax Paid | Tax Assessment Tax Assessment Total Assessment is a certain percentage of the fair market value that is determined by local assessors to be the total taxable value of land and additions on the property. | Land | Improvement |
|---|---|---|---|---|
| 2025 | $7,173 | $592,300 | $151,600 | $440,700 |
| 2024 | $6,623 | $551,000 | $151,600 | $399,400 |
| 2023 | $6,233 | $480,200 | $117,000 | $363,200 |
| 2022 | $5,863 | $419,700 | $106,600 | $313,100 |
| 2021 | $5,567 | $383,900 | $99,200 | $284,700 |
| 2020 | $5,559 | $366,900 | $95,000 | $271,900 |
| 2019 | $5,165 | $332,400 | $88,900 | $243,500 |
| 2018 | $4,241 | $264,100 | $88,900 | $175,200 |
| 2017 | $4,085 | $253,700 | $88,900 | $164,800 |
| 2016 | $4,012 | $231,100 | $85,100 | $146,000 |
| 2015 | $3,690 | $203,300 | $85,100 | $118,200 |
| 2014 | $3,818 | $210,600 | $85,100 | $125,500 |
Source: Public Records
Map
Nearby Homes