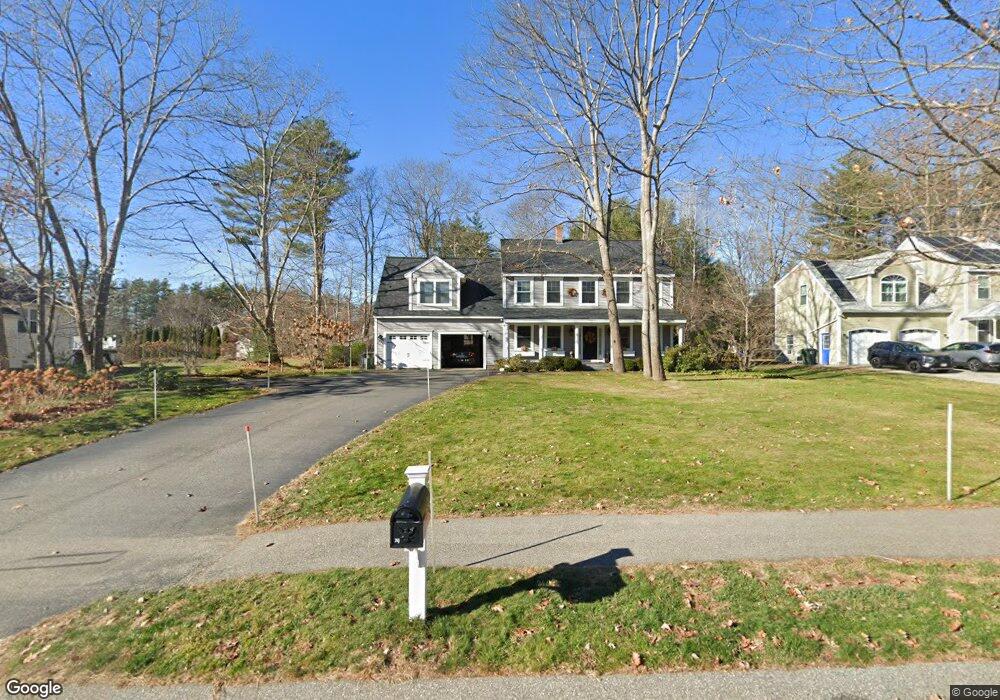
29 Hubbard St Saco, ME 04072
Central Saco NeighborhoodEstimated Value: $648,000 - $700,000
4
Beds
3
Baths
2,372
Sq Ft
$285/Sq Ft
Est. Value
About This Home
This home is located at 29 Hubbard St, Saco, ME 04072 and is currently estimated at $677,161, approximately $285 per square foot. 29 Hubbard St is a home located in York County with nearby schools including C K Burns School, Saco Middle School, and Saint James School.
Ownership History
Date
Name
Owned For
Owner Type
Purchase Details
Closed on
Nov 14, 2005
Sold by
Worster Cleve A Corp
Bought by
Thibeault Elizabeth P and Thibeault Joseph S
Current Estimated Value
Home Financials for this Owner
Home Financials are based on the most recent Mortgage that was taken out on this home.
Original Mortgage
$262,225
Outstanding Balance
$54,802
Interest Rate
5.93%
Mortgage Type
Unknown
Estimated Equity
$622,359
Create a Home Valuation Report for This Property
The Home Valuation Report is an in-depth analysis detailing your home's value as well as a comparison with similar homes in the area
Home Values in the Area
Average Home Value in this Area
Purchase History
| Date | Buyer | Sale Price | Title Company |
|---|---|---|---|
| Thibeault Elizabeth P | -- | -- |
Source: Public Records
Mortgage History
| Date | Status | Borrower | Loan Amount |
|---|---|---|---|
| Open | Thibeault Elizabeth P | $262,225 |
Source: Public Records
Tax History
| Year | Tax Paid | Tax Assessment Tax Assessment Total Assessment is a certain percentage of the fair market value that is determined by local assessors to be the total taxable value of land and additions on the property. | Land | Improvement |
|---|---|---|---|---|
| 2024 | $8,259 | $587,800 | $138,700 | $449,100 |
| 2023 | $8,583 | $581,900 | $138,700 | $443,200 |
| 2022 | $7,316 | $399,100 | $105,400 | $293,700 |
| 2021 | $7,010 | $371,300 | $95,200 | $276,100 |
| 2020 | $6,711 | $341,200 | $86,200 | $255,000 |
| 2019 | $6,612 | $341,200 | $86,200 | $255,000 |
| 2018 | $6,477 | $334,200 | $79,200 | $255,000 |
| 2017 | $6,545 | $337,700 | $79,200 | $258,500 |
| 2016 | $6,354 | $327,200 | $70,400 | $256,800 |
| 2015 | $6,225 | $323,900 | $70,400 | $253,500 |
| 2014 | $6,031 | $323,900 | $70,400 | $253,500 |
| 2013 | $6,018 | $323,900 | $70,400 | $253,500 |
Source: Public Records
Map
Nearby Homes
- TBD Oakland St
- 7 Hubbard St
- 8 Oakland St
- 22 Tasker St Unit 11
- 242 Lincoln St
- 7 Pleasant View Dr
- 51 Sancho Dr
- 120 Lincoln St
- 43 New County Rd
- 27 Pepperell St Unit 1
- 34 Pepperell St
- 391 Main St
- 66 W Cutts St
- 24 Dyer St
- 48 Hillview Ave
- 6 Lina Ave
- 10-12 Maple St
- 9 Nottingham Dr
- 674 South St
- 224 North St Unit 103
- 27 Hubbard St
- 31 Hubbard St
- 13 Evergreen Dr
- 15 Evergreen Dr
- 11 Evergreen Dr
- 17 Evergreen Dr
- 32 Hubbard St
- 20 Applewood Dr
- 21 Evergreen Dr
- 18 Applewood Dr
- 18 Applewood Dr Unit 1
- 7 Evergreen Dr
- 19 Evergreen Dr
- 19 Hubbard St
- 16 Applewood Dr
- 12 Evergreen Dr
- 23 Evergreen Dr
- 14 Applewood Dr
- 16 Evergreen Dr
- 14 Evergreen Dr
Your Personal Tour Guide
Ask me questions while you tour the home.