Estimated Value: $470,000 - $565,000
2
Beds
1
Bath
924
Sq Ft
$560/Sq Ft
Est. Value
About This Home
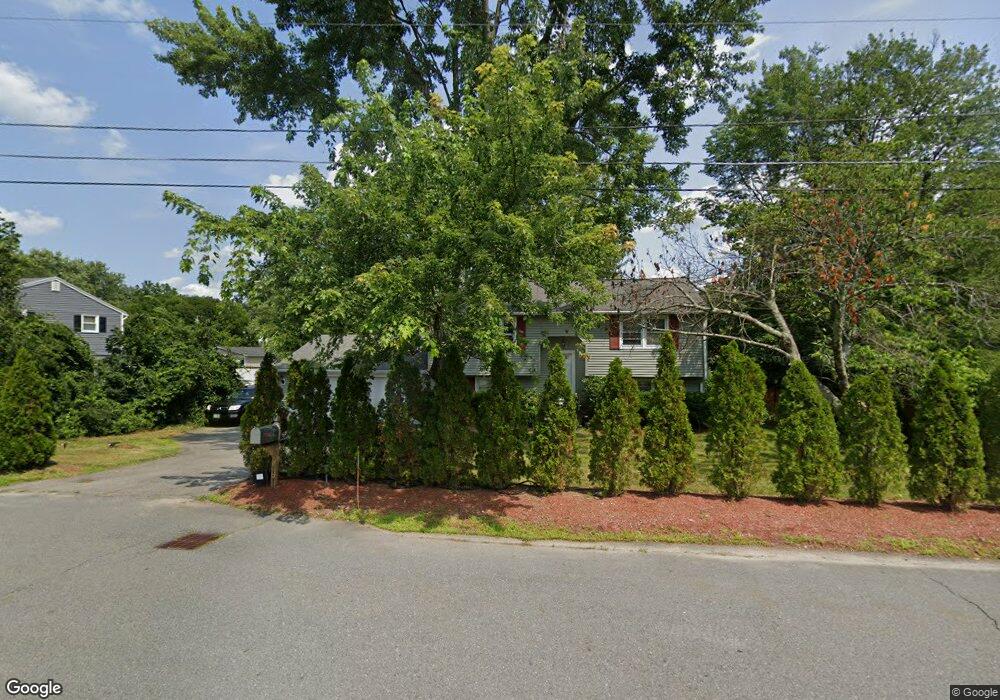
This home is located at 29 Joseph Rd, Salem, NH 03079 and is currently estimated at $517,561, approximately $560 per square foot. 29 Joseph Rd is a home located in Rockingham County with nearby schools including Mary A. Fisk Elementary School, Woodbury School, and Salem High School.
Create a Home Valuation Report for This Property
The Home Valuation Report is an in-depth analysis detailing your home's value as well as a comparison with similar homes in the area
Tax History
We collect this data history from publicly available records. To have your information removed, we recommend requesting removal directly through your county’s website.
| Year | Tax Paid | Tax Assessment Tax Assessment Total Assessment is a certain percentage of the fair market value that is determined by local assessors to be the total taxable value of land and additions on the property. | Land | Improvement |
|---|---|---|---|---|
| 2025 | $6,832 | $376,200 | $155,900 | $220,300 |
| 2024 | $6,621 | $376,200 | $155,900 | $220,300 |
| 2023 | $6,380 | $376,200 | $155,900 | $220,300 |
| 2022 | $6,038 | $376,200 | $155,900 | $220,300 |
| 2021 | $6,012 | $376,200 | $155,900 | $220,300 |
| 2020 | $5,368 | $243,800 | $111,200 | $132,600 |
| 2019 | $5,359 | $243,800 | $111,200 | $132,600 |
| 2018 | $5,269 | $243,800 | $111,200 | $132,600 |
| 2017 | $5,081 | $243,800 | $111,200 | $132,600 |
| 2016 | $4,981 | $243,800 | $111,200 | $132,600 |
| 2015 | $4,883 | $228,300 | $116,400 | $111,900 |
| 2014 | $4,746 | $228,300 | $116,400 | $111,900 |
| 2013 | $4,522 | $221,000 | $116,400 | $104,600 |
Source: Public Records
Map
Nearby Homes
- 3 Trina Rd
- 4 Alma Ave
- 20 Orchard Terrace
- 26 Veronica Ave
- 21 Sullivan Ct
- 26 Sullivan Ct
- 34 N Policy St Unit 34
- 12 Henry St
- 10 Sullivan Ave
- 13 Asbury St
- 30 Main St
- 144 N Policy St
- 1 S Policy St
- 95 Lake Shore Rd
- 30 Millville St
- 12 Millville St
- 97 Old Rockingham Rd
- 21 Goodridge Ave
- 181 Bluff St
- 23 Brookwood Dr
Your Personal Tour Guide
Ask me questions while you tour the home.