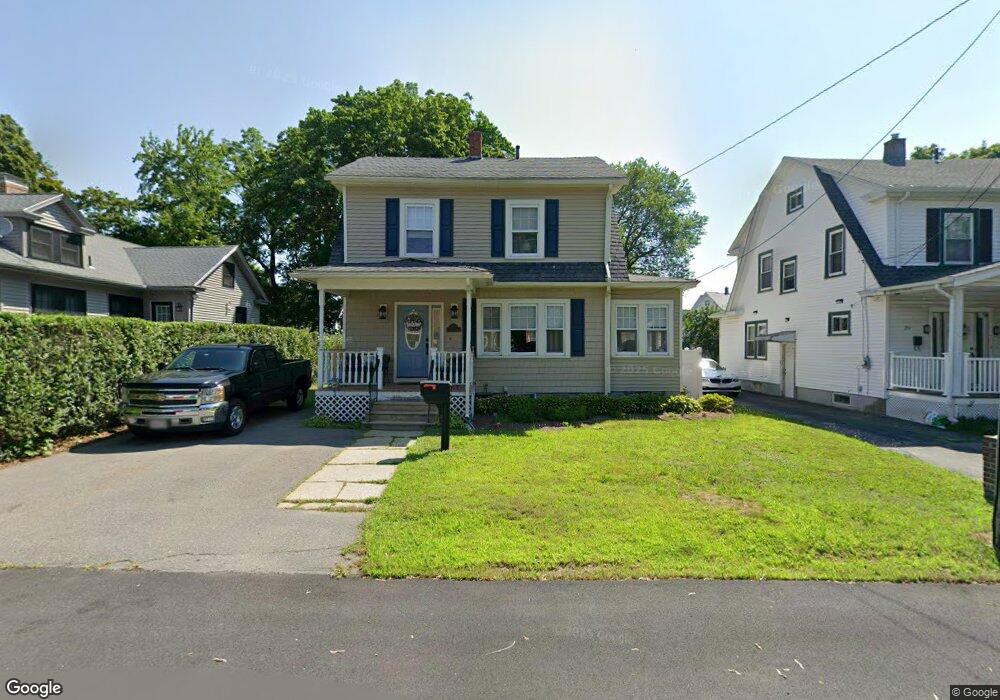
29 July St Lowell, MA 01850
Centralville NeighborhoodEstimated Value: $425,000 - $473,000
3
Beds
1
Bath
1,488
Sq Ft
$300/Sq Ft
Est. Value
About This Home
This home is located at 29 July St, Lowell, MA 01850 and is currently estimated at $446,806, approximately $300 per square foot. 29 July St is a home located in Middlesex County with nearby schools including S. Christa McAuliffe Elementary School, Greenhalge Elementary School, and Moody Elementary School.
Ownership History
Date
Name
Owned For
Owner Type
Purchase Details
Closed on
Mar 31, 2003
Sold by
Mccarthy Gretchen and Mccarthy Robert J
Bought by
Stoia Sharon
Current Estimated Value
Home Financials for this Owner
Home Financials are based on the most recent Mortgage that was taken out on this home.
Original Mortgage
$45,000
Outstanding Balance
$19,216
Interest Rate
5.91%
Mortgage Type
Purchase Money Mortgage
Estimated Equity
$427,590
Purchase Details
Closed on
Jun 30, 1994
Sold by
Tsitsinopoulos Michael and Tsitsinopoulos C
Bought by
Mccarthy Robert J and Mccarthy Gretchen
Home Financials for this Owner
Home Financials are based on the most recent Mortgage that was taken out on this home.
Original Mortgage
$1,940
Interest Rate
8.52%
Create a Home Valuation Report for This Property
The Home Valuation Report is an in-depth analysis detailing your home's value as well as a comparison with similar homes in the area
Home Values in the Area
Average Home Value in this Area
Purchase History
| Date | Buyer | Sale Price | Title Company |
|---|---|---|---|
| Stoia Sharon | $225,000 | -- | |
| Stoia Sharon | $225,000 | -- | |
| Stoia Sharon | $225,000 | -- | |
| Mccarthy Robert J | $97,000 | -- | |
| Mccarthy Robert J | $97,000 | -- |
Source: Public Records
Mortgage History
| Date | Status | Borrower | Loan Amount |
|---|---|---|---|
| Open | Stoia Sharon | $45,000 | |
| Closed | Mccarthy Robert J | $45,000 | |
| Previous Owner | Mccarthy Robert J | $1,940 |
Source: Public Records
Tax History
| Year | Tax Paid | Tax Assessment Tax Assessment Total Assessment is a certain percentage of the fair market value that is determined by local assessors to be the total taxable value of land and additions on the property. | Land | Improvement |
|---|---|---|---|---|
| 2025 | $4,104 | $357,500 | $148,900 | $208,600 |
| 2024 | $4,143 | $347,900 | $139,200 | $208,700 |
| 2023 | $3,895 | $313,600 | $121,000 | $192,600 |
| 2022 | $3,497 | $275,600 | $110,000 | $165,600 |
| 2021 | $3,263 | $242,400 | $95,700 | $146,700 |
| 2020 | $2,991 | $223,900 | $83,600 | $140,300 |
| 2019 | $2,901 | $206,600 | $77,500 | $129,100 |
| 2018 | $2,875 | $199,800 | $73,800 | $126,000 |
| 2017 | $2,771 | $185,700 | $67,100 | $118,600 |
| 2016 | $2,789 | $184,000 | $65,400 | $118,600 |
| 2015 | $2,653 | $171,400 | $65,400 | $106,000 |
| 2013 | $2,636 | $175,600 | $76,500 | $99,100 |
Source: Public Records
Map
Nearby Homes
- 18 May St
- 106 Methuen St Unit B
- 35 Whitney Ave Unit 33
- 23 18th St
- Lot 11 Christian St
- Lot 12 Christian St
- Lot 9 Christian St
- Lot 10 Christian St
- 99 W 6th St
- 27-29 Fifth St
- 668 Robbins Ave Unit 1
- 45 W 4th St
- 4 Hazelwood Ave Unit 12
- 700 Robbins Ave Unit 6
- 175 Willard St Unit 9
- 15 Dana St
- 105 3rd St
- 81 Reservoir St
- 25 Read St
- 144 Thissell Ave Unit 11
Your Personal Tour Guide
Ask me questions while you tour the home.