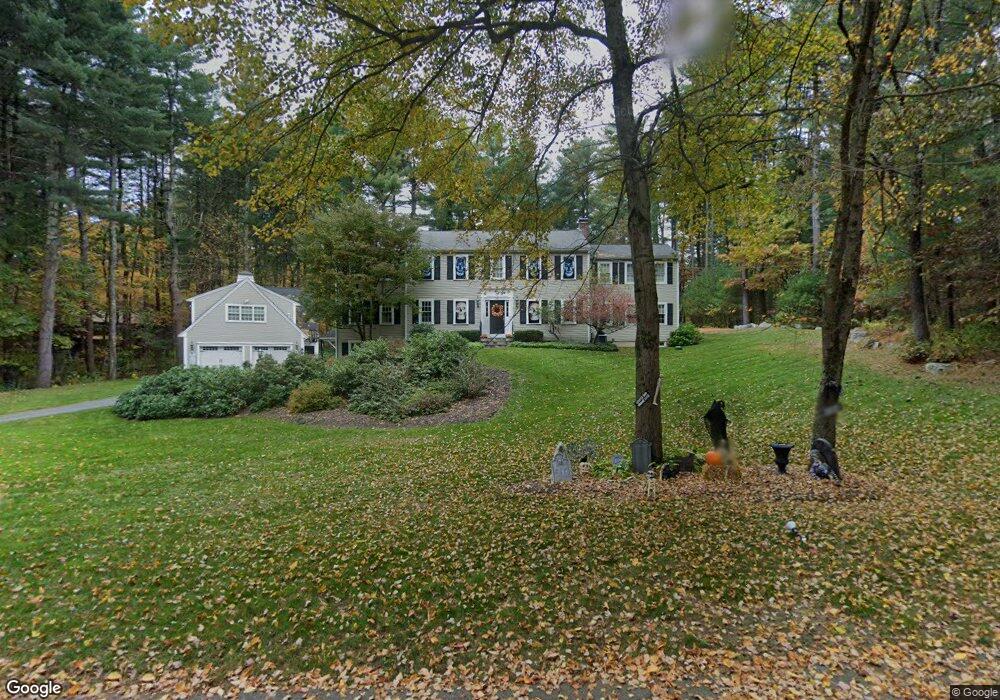
29 Juniper Rd Sudbury, MA 01776
Estimated Value: $1,481,000 - $1,806,000
5
Beds
5
Baths
4,134
Sq Ft
$398/Sq Ft
Est. Value
About This Home
This home is located at 29 Juniper Rd, Sudbury, MA 01776 and is currently estimated at $1,643,344, approximately $397 per square foot. 29 Juniper Rd is a home located in Middlesex County with nearby schools including General John Nixon Elementary School, Ephraim Curtis Middle School, and Lincoln-Sudbury Regional High School.
Ownership History
Date
Name
Owned For
Owner Type
Purchase Details
Closed on
Aug 20, 2025
Sold by
Carlson Eileen M and Carlson James A
Bought by
Eileen M Carlson Lt and Carlson
Current Estimated Value
Purchase Details
Closed on
Nov 15, 2010
Sold by
Carlson Eileen M
Bought by
Carlson Eileen M and Carlson James A
Home Financials for this Owner
Home Financials are based on the most recent Mortgage that was taken out on this home.
Original Mortgage
$316,000
Interest Rate
4.22%
Purchase Details
Closed on
Mar 25, 2010
Sold by
Carlson James A and Carlson Eileen M
Bought by
Carlson Eileen M
Purchase Details
Closed on
Jun 27, 1994
Sold by
Eklem Christopher and Eklem Janice
Bought by
Carlson James A and Carlson Eileen M
Purchase Details
Closed on
Mar 1, 1993
Sold by
Grossman Irwin R and Grossman Laura S
Bought by
Eklmen Christopher and Eklem Janice
Create a Home Valuation Report for This Property
The Home Valuation Report is an in-depth analysis detailing your home's value as well as a comparison with similar homes in the area
Home Values in the Area
Average Home Value in this Area
Purchase History
| Date | Buyer | Sale Price | Title Company |
|---|---|---|---|
| Eileen M Carlson Lt | -- | -- | |
| Eileen M Carlson Lt | -- | -- | |
| Carlson Eileen M | -- | -- | |
| Carlson Eileen M | -- | -- | |
| Carlson Eileen M | -- | -- | |
| Carlson Eileen M | -- | -- | |
| Carlson James A | $414,000 | -- | |
| Carlson James A | $414,000 | -- | |
| Eklmen Christopher | $390,000 | -- | |
| Eklmen Christopher | $390,000 | -- |
Source: Public Records
Mortgage History
| Date | Status | Borrower | Loan Amount |
|---|---|---|---|
| Previous Owner | Eklmen Christopher | $417,000 | |
| Previous Owner | Eklmen Christopher | $316,000 |
Source: Public Records
Tax History Compared to Growth
Tax History
| Year | Tax Paid | Tax Assessment Tax Assessment Total Assessment is a certain percentage of the fair market value that is determined by local assessors to be the total taxable value of land and additions on the property. | Land | Improvement |
|---|---|---|---|---|
| 2025 | $22,114 | $1,510,500 | $501,000 | $1,009,500 |
| 2024 | $21,291 | $1,457,300 | $486,600 | $970,700 |
| 2023 | $19,684 | $1,248,200 | $434,600 | $813,600 |
| 2022 | $18,934 | $1,049,000 | $398,600 | $650,400 |
| 2021 | $17,783 | $944,400 | $398,600 | $545,800 |
| 2020 | $17,424 | $944,400 | $398,600 | $545,800 |
| 2019 | $16,914 | $944,400 | $398,600 | $545,800 |
| 2018 | $16,540 | $922,500 | $424,200 | $498,300 |
| 2017 | $16,216 | $914,100 | $420,600 | $493,500 |
| 2016 | $15,732 | $883,800 | $404,600 | $479,200 |
| 2015 | $15,263 | $867,200 | $393,000 | $474,200 |
| 2014 | $15,255 | $846,100 | $381,400 | $464,700 |
Source: Public Records
Map
Nearby Homes
- 63 Canterbury Dr
- 427 Concord Rd
- 24 Goodnow Rd
- 55 Widow Rites Ln
- 45 Widow Rites Ln
- 36 Old Forge Ln
- 14 Frost Ln
- 12 Camperdown Ln
- 54 Phillips Rd
- 4 Elderberry Cir
- 47 Fairbank Rd
- 5 Taintor Dr
- 270 Old Lancaster Rd
- 42 Dakin Rd
- 941 Concord Rd
- 166 Parker St Unit 4
- 57 Longfellow Rd
- 16 Blacksmith Dr
- 67 Old Marlboro Rd
- Lot 5 Sailaway Ln
- 62 Wake Robin Rd
- 15 Juniper Rd
- 24 Juniper Rd
- 72 Wake Robin Rd
- 16 Juniper Rd
- 54 Wake Robin Rd
- 30 Juniper Rd
- 48 Wake Robin Rd
- 135 Morse Rd
- 7 Juniper Rd
- 8 Juniper Rd
- 63 Wake Robin Rd
- 78 Wake Robin Rd
- 34 Wake Robin Rd
- 55 Wake Robin Rd
- 67 Wake Robin Rd
- 149 Morse Rd
- 127 Morse Rd
- 47 Wake Robin Rd
- 75 Wake Robin Rd