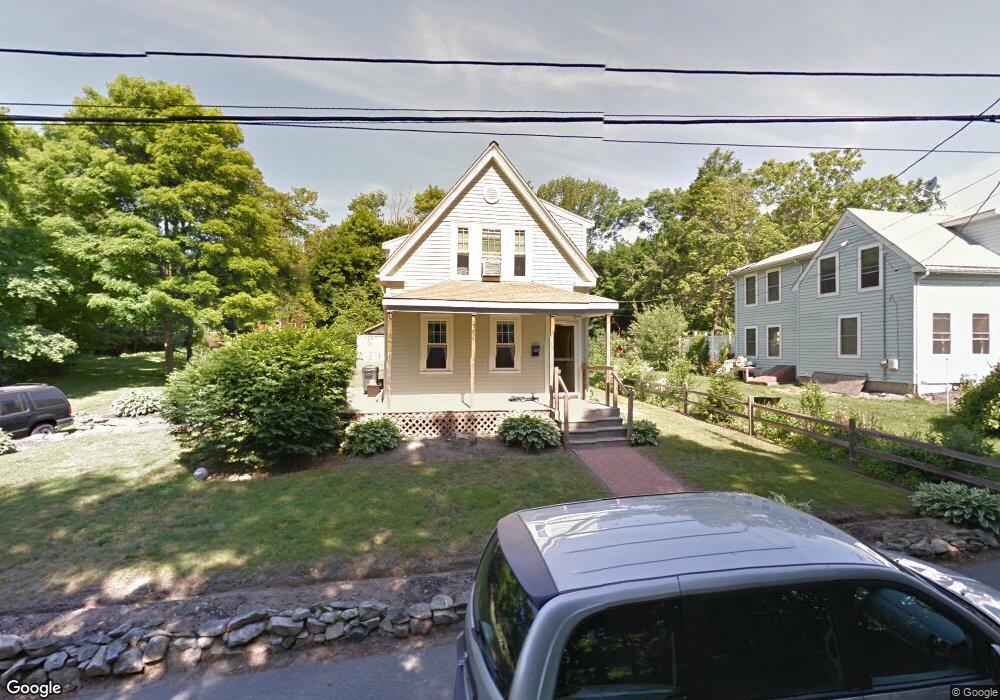
29 King St Abington, MA 02351
Estimated Value: $504,000 - $547,000
3
Beds
2
Baths
1,514
Sq Ft
$342/Sq Ft
Est. Value
About This Home
This home is located at 29 King St, Abington, MA 02351 and is currently estimated at $518,163, approximately $342 per square foot. 29 King St is a home located in Plymouth County with nearby schools including Beaver Brook Elementary School, Abington Middle School, and Woodsdale School.
Ownership History
Date
Name
Owned For
Owner Type
Purchase Details
Closed on
May 3, 2002
Sold by
Olde Towne Realty Sale
Bought by
Oconnor Robert S and Oconnor Patricia J
Current Estimated Value
Home Financials for this Owner
Home Financials are based on the most recent Mortgage that was taken out on this home.
Original Mortgage
$348,000
Outstanding Balance
$149,013
Interest Rate
7.13%
Mortgage Type
Purchase Money Mortgage
Estimated Equity
$369,150
Purchase Details
Closed on
Jun 30, 1992
Sold by
Harriss Ronald E
Bought by
Doyle Steven J and Doyle Suzanne B
Create a Home Valuation Report for This Property
The Home Valuation Report is an in-depth analysis detailing your home's value as well as a comparison with similar homes in the area
Home Values in the Area
Average Home Value in this Area
Purchase History
| Date | Buyer | Sale Price | Title Company |
|---|---|---|---|
| Oconnor Robert S | $195,000 | -- | |
| Doyle Steven J | $150,000 | -- |
Source: Public Records
Mortgage History
| Date | Status | Borrower | Loan Amount |
|---|---|---|---|
| Open | Doyle Steven J | $39,350 | |
| Closed | Doyle Steven J | $11,000 | |
| Open | Doyle Steven J | $348,000 | |
| Previous Owner | Doyle Steven J | $190,000 |
Source: Public Records
Tax History
| Year | Tax Paid | Tax Assessment Tax Assessment Total Assessment is a certain percentage of the fair market value that is determined by local assessors to be the total taxable value of land and additions on the property. | Land | Improvement |
|---|---|---|---|---|
| 2025 | $5,894 | $451,300 | $241,300 | $210,000 |
| 2024 | $5,784 | $432,300 | $219,600 | $212,700 |
| 2023 | $5,701 | $401,200 | $191,200 | $210,000 |
| 2022 | $5,499 | $361,300 | $167,600 | $193,700 |
| 2021 | $5,406 | $310,200 | $152,200 | $158,000 |
| 2020 | $8,905 | $305,600 | $147,600 | $158,000 |
| 2019 | $4,605 | $279,200 | $140,700 | $138,500 |
| 2018 | $4,792 | $268,900 | $140,700 | $128,200 |
| 2017 | $4,543 | $247,600 | $140,700 | $106,900 |
| 2016 | $4,321 | $241,000 | $134,100 | $106,900 |
| 2015 | $4,078 | $239,900 | $134,100 | $105,800 |
Source: Public Records
Map
Nearby Homes
- 101 Highfields Rd
- 87 Summer St
- 45 Groveland St
- 13 Mahoney Cir
- 9 Lydon Ln Unit A1-9
- 94 Progress St Unit 94
- 360 High St
- 456 Beulah St
- 48 Sullivan Terrace
- 9 Karen Ln
- 77 Clapp St
- 300 High St
- 11 Broadmeadow Ln
- 877 Brockton Ave Unit 877
- 56-58 Vernon St
- 90 Loring Ave
- 157 Warren Ave
- 545 W Water St
- 209 Central St
- 59 Pomona Dr
Your Personal Tour Guide
Ask me questions while you tour the home.