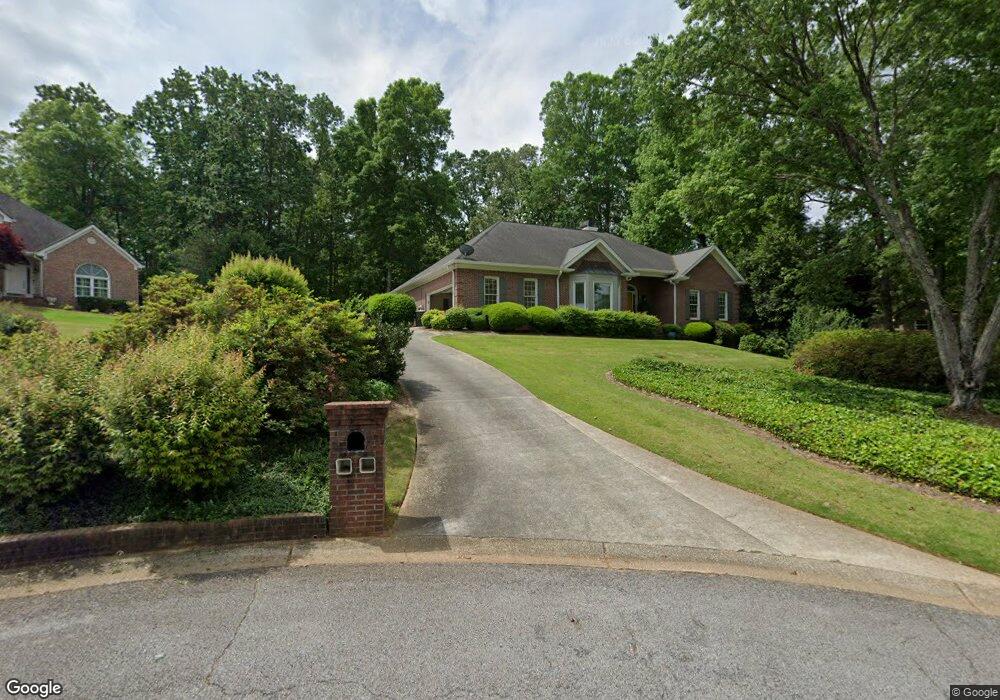
29 Kitzingen Ct Unit 21 Carrollton, GA 30116
Estimated Value: $538,000 - $648,000
6
Beds
4
Baths
2,774
Sq Ft
$219/Sq Ft
Est. Value
About This Home
This home is located at 29 Kitzingen Ct Unit 21, Carrollton, GA 30116 and is currently estimated at $608,333, approximately $219 per square foot. 29 Kitzingen Ct Unit 21 is a home located in Carroll County with nearby schools including Central Elementary School, Central Middle School, and Central High School.
Ownership History
Date
Name
Owned For
Owner Type
Purchase Details
Closed on
Feb 18, 2025
Sold by
Kubik Steven
Bought by
Wadlington Cynthia L
Current Estimated Value
Purchase Details
Closed on
Jun 2, 2023
Sold by
Kubik Steven
Bought by
Home Saver 911 Llc
Purchase Details
Closed on
Aug 13, 2015
Sold by
Kubik Steven R
Bought by
Colin Brian and Byram Charles F
Purchase Details
Closed on
Oct 24, 2014
Sold by
Bryson J G
Bought by
Kubik Steven and Kubik Brook
Purchase Details
Closed on
Jun 8, 2007
Sold by
Goldin Kathryn B
Bought by
Kubik Steven R
Purchase Details
Closed on
May 4, 2007
Sold by
Morgan Mimi Bass
Bought by
Goldin Kathryn B
Purchase Details
Closed on
Mar 13, 2006
Sold by
Goldin Kathryn B
Bought by
Bass E C
Purchase Details
Closed on
Oct 2, 1991
Bought by
Bryson Bryson J and Bryson Earlene
Create a Home Valuation Report for This Property
The Home Valuation Report is an in-depth analysis detailing your home's value as well as a comparison with similar homes in the area
Home Values in the Area
Average Home Value in this Area
Purchase History
| Date | Buyer | Sale Price | Title Company |
|---|---|---|---|
| Wadlington Cynthia L | -- | -- | |
| Wadlington Cynthia L | $243,654 | -- | |
| Home Saver 911 Llc | -- | -- | |
| Colin Brian | $208,000 | -- | |
| Kubik Steven | $275,000 | -- | |
| Kubik Steven R | $140,100 | -- | |
| Goldin Kathryn B | -- | -- | |
| Goldin Kathryn B | -- | -- | |
| Goldin Kathryn B | -- | -- | |
| Bass E C | -- | -- | |
| Bryson Bryson J | $16,000 | -- |
Source: Public Records
Tax History
| Year | Tax Paid | Tax Assessment Tax Assessment Total Assessment is a certain percentage of the fair market value that is determined by local assessors to be the total taxable value of land and additions on the property. | Land | Improvement |
|---|---|---|---|---|
| 2025 | $5,250 | $234,716 | $11,000 | $223,716 |
| 2024 | $5,310 | $234,716 | $11,000 | $223,716 |
| 2023 | $5,310 | $214,196 | $11,000 | $203,196 |
| 2022 | $3,683 | $174,314 | $11,000 | $163,314 |
| 2021 | $3,345 | $150,541 | $11,000 | $139,541 |
| 2020 | $3,054 | $134,183 | $11,000 | $123,183 |
| 2019 | $2,935 | $126,508 | $11,000 | $115,508 |
| 2018 | $2,441 | $97,088 | $11,000 | $86,088 |
| 2017 | $2,441 | $96,688 | $11,000 | $85,688 |
| 2016 | $2,442 | $96,688 | $11,000 | $85,688 |
| 2015 | $3,033 | $108,462 | $11,550 | $96,912 |
| 2014 | $767 | $108,462 | $11,550 | $96,912 |
Source: Public Records
Map
Nearby Homes
- 211 Castleman Rd
- 52 Castleman Rd
- 229 Emma Gilley Dr
- 0 Cross Plains Rd Unit 10644288
- 0 Cross Plains Rd Unit 7682594
- 1005 Oak Mountain Rd
- 120 National Way
- 103 Birkdale Blvd
- 0 Hwy 166 E Unit 10706940
- 0 Hwy 166 E Unit 7732324
- 0 Bankhead Hwy and Sassafras Unit 202
- 103 River Birch Dr
- 116 National Way
- 22 Mill Trace
- 109 National Way
- 391 Foggy Bottom Dr
- 214 Asher Dr
- 116 Camilla Dr
- 24 Hunters Glen
- 158 Foggy Bottom Dr
- 29 Kitzingen Ct
- 39 Kitzingen Ct
- 131 Laurel Lakes Dr
- 137 Laurel Lakes Dr
- 119 Laurel Lakes Dr
- 47 Kitzingen Ct
- 22 Kitzingen Ct
- 34 Kitzingen Ct
- 140 Castleman Rd
- 161 Castleman Rd
- 183 Castleman Rd
- 44 Kitzingen Ct
- 109 Laurel Lakes Dr
- 149 Castleman Rd
- 138 Laurel Lakes Dr
- 9 London Way
- 155 Castleman Rd
- 99 Laurel Lakes Dr
- 00 LOT 134 Castleman Rd
- 19 London Way
Your Personal Tour Guide
Ask me questions while you tour the home.