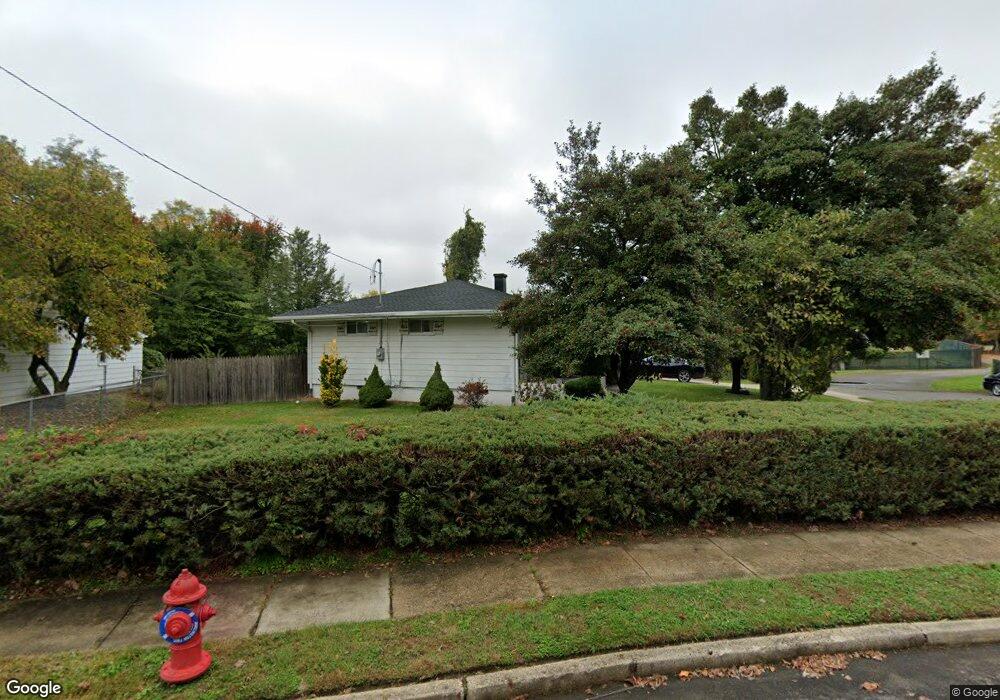
29 Larkin Rd Burlington, NJ 08016
Estimated Value: $297,000 - $342,000
Studio
--
Bath
1,484
Sq Ft
$219/Sq Ft
Est. Value
About This Home
This home is located at 29 Larkin Rd, Burlington, NJ 08016 and is currently estimated at $325,348, approximately $219 per square foot. 29 Larkin Rd is a home located in Burlington County with nearby schools including B Bernice Young Elementary School, Fountain Woods Elementary School, and Burlington Township Middle School at Springside.
Ownership History
Date
Name
Owned For
Owner Type
Purchase Details
Closed on
Feb 9, 2007
Sold by
Thompson Felton and Thompson Helen
Bought by
Quintanilla Edgardo A and Quintanilla Silvia
Current Estimated Value
Home Financials for this Owner
Home Financials are based on the most recent Mortgage that was taken out on this home.
Original Mortgage
$185,000
Outstanding Balance
$111,238
Interest Rate
6.23%
Mortgage Type
Purchase Money Mortgage
Estimated Equity
$214,110
Create a Home Valuation Report for This Property
The Home Valuation Report is an in-depth analysis detailing your home's value as well as a comparison with similar homes in the area
Home Values in the Area
Average Home Value in this Area
Purchase History
| Date | Buyer | Sale Price | Title Company |
|---|---|---|---|
| Quintanilla Edgardo A | $185,000 | Surety Title Corp |
Source: Public Records
Mortgage History
| Date | Status | Borrower | Loan Amount |
|---|---|---|---|
| Open | Quintanilla Edgardo A | $185,000 |
Source: Public Records
Tax History
| Year | Tax Paid | Tax Assessment Tax Assessment Total Assessment is a certain percentage of the fair market value that is determined by local assessors to be the total taxable value of land and additions on the property. | Land | Improvement |
|---|---|---|---|---|
| 2025 | $4,603 | $151,800 | $39,900 | $111,900 |
| 2024 | $4,534 | $151,800 | $39,900 | $111,900 |
| 2023 | $4,534 | $151,800 | $39,900 | $111,900 |
| 2022 | $4,515 | $151,800 | $39,900 | $111,900 |
| 2021 | $4,560 | $151,800 | $39,900 | $111,900 |
| 2020 | $4,549 | $151,800 | $39,900 | $111,900 |
| 2019 | $4,560 | $151,800 | $39,900 | $111,900 |
| 2018 | $4,492 | $151,800 | $39,900 | $111,900 |
| 2017 | $4,464 | $151,800 | $39,900 | $111,900 |
| 2016 | $5,229 | $174,300 | $44,500 | $129,800 |
| 2015 | $5,138 | $174,300 | $44,500 | $129,800 |
| 2014 | $4,950 | $174,300 | $44,500 | $129,800 |
Source: Public Records
Map
Nearby Homes
- 13 Lancaster Dr
- 16 Langrock Way
- 3 Parker Ave
- 3 Horseshoe Dr
- 37 Equestrian Dr
- 62 Stirrup Way
- 10 Laclede Dr
- 44 Brook Dr
- 79 Steeplechase Blvd
- 952 Columbus Rd
- 1004 Armistice Dr
- 431 Independence Dr
- 955 Easter Rd
- 109 Thompson St
- 105 Thompson St
- 111 Thompson St
- 929 Bordentown Rd
- 911 Allison Rd
- 839 Bordentown Rd
- 813 Mount Rd
Your Personal Tour Guide
Ask me questions while you tour the home.