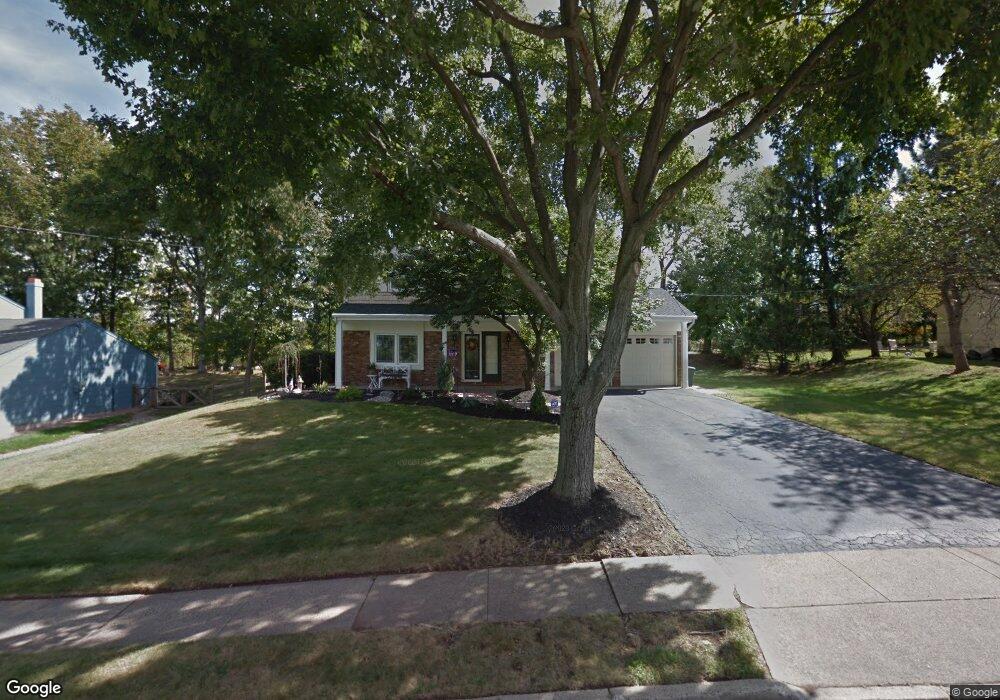
29 Layne Rd Somerset, NJ 08873
Estimated Value: $702,000 - $708,000
--
Bed
--
Bath
2,300
Sq Ft
$306/Sq Ft
Est. Value
About This Home
This home is located at 29 Layne Rd, Somerset, NJ 08873 and is currently estimated at $704,793, approximately $306 per square foot. 29 Layne Rd is a home located in Somerset County with nearby schools including Franklin High School, Cedar Hill Preparatory School, and Rutgers Preparatory School.
Ownership History
Date
Name
Owned For
Owner Type
Purchase Details
Closed on
Aug 27, 2009
Sold by
Becker Ronald and Moore Becker Nicolia
Bought by
Pome Wilber and Pome Evita
Current Estimated Value
Home Financials for this Owner
Home Financials are based on the most recent Mortgage that was taken out on this home.
Original Mortgage
$374,890
Outstanding Balance
$247,285
Interest Rate
5.36%
Mortgage Type
VA
Estimated Equity
$457,508
Purchase Details
Closed on
Nov 22, 2002
Sold by
Hirsch Paul
Bought by
Becker Ronald
Home Financials for this Owner
Home Financials are based on the most recent Mortgage that was taken out on this home.
Original Mortgage
$250,000
Interest Rate
6.16%
Create a Home Valuation Report for This Property
The Home Valuation Report is an in-depth analysis detailing your home's value as well as a comparison with similar homes in the area
Home Values in the Area
Average Home Value in this Area
Purchase History
| Date | Buyer | Sale Price | Title Company |
|---|---|---|---|
| Pome Wilber | $367,000 | None Available | |
| Becker Ronald | $332,500 | -- |
Source: Public Records
Mortgage History
| Date | Status | Borrower | Loan Amount |
|---|---|---|---|
| Open | Pome Wilber | $374,890 | |
| Previous Owner | Becker Ronald | $250,000 |
Source: Public Records
Tax History Compared to Growth
Tax History
| Year | Tax Paid | Tax Assessment Tax Assessment Total Assessment is a certain percentage of the fair market value that is determined by local assessors to be the total taxable value of land and additions on the property. | Land | Improvement |
|---|---|---|---|---|
| 2025 | $10,477 | $669,600 | $370,000 | $299,600 |
| 2024 | $10,477 | $575,000 | $370,000 | $205,000 |
| 2023 | $9,797 | $505,000 | $300,000 | $205,000 |
| 2022 | $9,318 | $455,000 | $250,000 | $205,000 |
| 2021 | $8,713 | $402,100 | $200,000 | $202,100 |
| 2020 | $8,967 | $392,100 | $190,000 | $202,100 |
| 2019 | $8,625 | $372,100 | $170,000 | $202,100 |
| 2018 | $8,363 | $357,100 | $155,000 | $202,100 |
| 2017 | $8,160 | $347,100 | $145,000 | $202,100 |
| 2016 | $7,820 | $329,800 | $135,000 | $194,800 |
| 2015 | $7,399 | $324,800 | $130,000 | $194,800 |
| 2014 | $7,633 | $339,800 | $145,000 | $194,800 |
Source: Public Records
Map
Nearby Homes