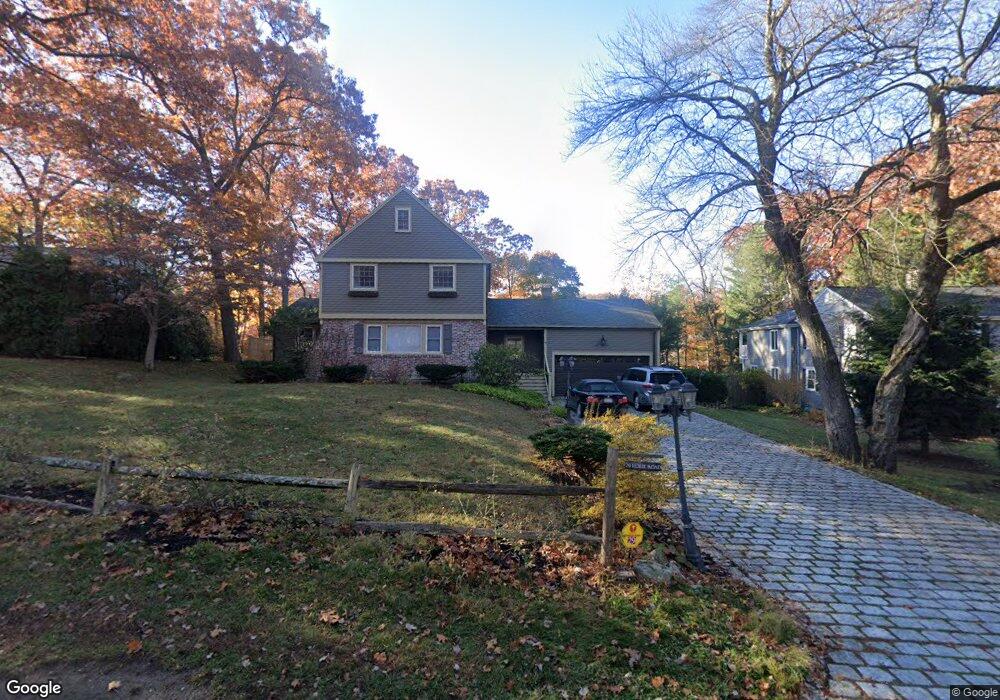
29 Leslie Rd Winchester, MA 01890
Estimated Value: $1,913,275 - $2,242,000
3
Beds
3
Baths
2,895
Sq Ft
$722/Sq Ft
Est. Value
About This Home
This home is located at 29 Leslie Rd, Winchester, MA 01890 and is currently estimated at $2,091,319, approximately $722 per square foot. 29 Leslie Rd is a home located in Middlesex County with nearby schools including Lincoln Elementary School, McCall Middle School, and Winchester High School.
Ownership History
Date
Name
Owned For
Owner Type
Purchase Details
Closed on
Dec 14, 2010
Sold by
Navarro Kimberly
Bought by
Hannon Jeffrey C and Marois Jeanne M
Current Estimated Value
Home Financials for this Owner
Home Financials are based on the most recent Mortgage that was taken out on this home.
Original Mortgage
$320,000
Outstanding Balance
$211,633
Interest Rate
4.24%
Mortgage Type
Purchase Money Mortgage
Estimated Equity
$1,879,686
Purchase Details
Closed on
Jul 30, 2004
Sold by
Middlesex Holt Ft
Bought by
Navarro Kimberly
Create a Home Valuation Report for This Property
The Home Valuation Report is an in-depth analysis detailing your home's value as well as a comparison with similar homes in the area
Purchase History
| Date | Buyer | Sale Price | Title Company |
|---|---|---|---|
| Hannon Jeffrey C | $823,875 | -- | |
| Navarro Kimberly | $750,000 | -- |
Source: Public Records
Mortgage History
| Date | Status | Borrower | Loan Amount |
|---|---|---|---|
| Open | Hannon Jeffrey C | $320,000 |
Source: Public Records
Tax History
| Year | Tax Paid | Tax Assessment Tax Assessment Total Assessment is a certain percentage of the fair market value that is determined by local assessors to be the total taxable value of land and additions on the property. | Land | Improvement |
|---|---|---|---|---|
| 2025 | $184 | $1,658,300 | $1,095,500 | $562,800 |
| 2024 | $17,422 | $1,537,700 | $1,017,300 | $520,400 |
| 2023 | $17,101 | $1,449,200 | $939,000 | $510,200 |
| 2022 | $15,366 | $1,228,300 | $821,700 | $406,600 |
| 2021 | $9,288 | $1,159,800 | $753,200 | $406,600 |
| 2020 | $9,791 | $1,159,800 | $753,200 | $406,600 |
| 2019 | $12,861 | $1,062,000 | $655,400 | $406,600 |
| 2018 | $8,846 | $1,019,500 | $624,100 | $395,400 |
| 2017 | $73 | $998,800 | $624,100 | $374,700 |
| 2016 | $11,536 | $987,700 | $624,100 | $363,600 |
| 2015 | $11,138 | $917,500 | $567,300 | $350,200 |
| 2014 | $10,296 | $813,300 | $474,400 | $338,900 |
Source: Public Records
Map
Nearby Homes
- 39 Town Way
- 6 Marchant Rd
- 19 Town Way
- 1 Town Way
- 263 Highland Ave
- 9 Lakeview Terrace
- 61 Grove St
- 20 Grove Place
- 13 Nelson St
- 545 Winthrop St Unit Lot 6
- 545 Winthrop St Unit Lot 8
- 545 Winthrop St Unit Lot 7
- 666 Main St Unit 312
- 22 Oak St
- 9 Wildwood Rd
- 49 Spruce St
- 27 Everett Ave
- 10 Sheffield W
- 40 Century St
- 353-355 Washington St