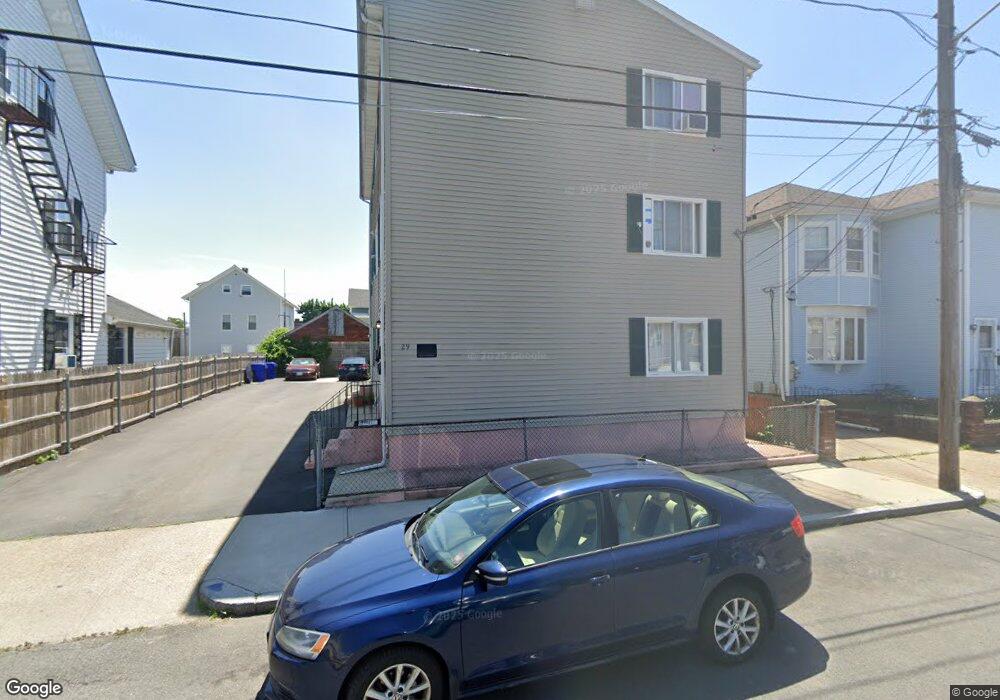
29 Lilac St Pawtucket, RI 02860
Pleasant View NeighborhoodEstimated Value: $638,856 - $752,000
9
Beds
3
Baths
4,160
Sq Ft
$166/Sq Ft
Est. Value
About This Home
This home is located at 29 Lilac St, Pawtucket, RI 02860 and is currently estimated at $688,964, approximately $165 per square foot. 29 Lilac St is a home located in Providence County with nearby schools including Saint Raphael Academy.
Ownership History
Date
Name
Owned For
Owner Type
Purchase Details
Closed on
Feb 8, 2012
Sold by
Alves John R and Alves Maria C
Bought by
Alves Ft
Current Estimated Value
Purchase Details
Closed on
Mar 31, 2003
Sold by
Dagraca Antonio J
Bought by
Alves John R and Alves Maria C
Home Financials for this Owner
Home Financials are based on the most recent Mortgage that was taken out on this home.
Original Mortgage
$215,900
Interest Rate
5.91%
Purchase Details
Closed on
Jan 6, 1995
Sold by
Monteiro Tiago G and Monteiro Maria
Bought by
Dagraca Antonio J and Mendes Jose N
Home Financials for this Owner
Home Financials are based on the most recent Mortgage that was taken out on this home.
Original Mortgage
$142,076
Interest Rate
9.23%
Create a Home Valuation Report for This Property
The Home Valuation Report is an in-depth analysis detailing your home's value as well as a comparison with similar homes in the area
Home Values in the Area
Average Home Value in this Area
Purchase History
| Date | Buyer | Sale Price | Title Company |
|---|---|---|---|
| Alves Ft | -- | -- | |
| Alves John R | $270,000 | -- | |
| Dagraca Antonio J | $144,000 | -- |
Source: Public Records
Mortgage History
| Date | Status | Borrower | Loan Amount |
|---|---|---|---|
| Previous Owner | Dagraca Antonio J | $255,000 | |
| Previous Owner | Dagraca Antonio J | $215,900 | |
| Previous Owner | Dagraca Antonio J | $141,950 | |
| Previous Owner | Dagraca Antonio J | $142,076 |
Source: Public Records
Tax History
| Year | Tax Paid | Tax Assessment Tax Assessment Total Assessment is a certain percentage of the fair market value that is determined by local assessors to be the total taxable value of land and additions on the property. | Land | Improvement |
|---|---|---|---|---|
| 2025 | $6,438 | $489,600 | $127,400 | $362,200 |
| 2024 | $6,042 | $489,600 | $127,400 | $362,200 |
| 2023 | $5,199 | $306,900 | $64,000 | $242,900 |
| 2022 | $5,088 | $306,900 | $64,000 | $242,900 |
| 2021 | $5,088 | $306,900 | $64,000 | $242,900 |
| 2020 | $3,994 | $191,200 | $47,200 | $144,000 |
| 2019 | $3,994 | $191,200 | $47,200 | $144,000 |
| 2018 | $3,849 | $191,200 | $47,200 | $144,000 |
| 2017 | $3,940 | $173,400 | $41,000 | $132,400 |
| 2016 | $3,796 | $173,400 | $41,000 | $132,400 |
| 2015 | $3,796 | $173,400 | $41,000 | $132,400 |
| 2014 | $2,956 | $128,200 | $41,000 | $87,200 |
Source: Public Records
Map
Nearby Homes
- 79 W Cole St
- 101 Gooding St
- 11 Appleton Ave
- 208 Sabin St
- 300 Front St Unit 105
- 300 Front St Unit 409
- 35 Laurel St
- 39 Webster St Unit 204
- 211 Carnation St
- 27 Collins Ave
- 54 Sabin St
- 735 Broadway
- 511 High St
- 153 Central Ave
- 517 High St
- 30 Foundry St Unit 6
- 404 Roosevelt Ave Unit 401
- 7 Fales St
- 396 Roosevelt Ave
- 48 Kossuth St
Your Personal Tour Guide
Ask me questions while you tour the home.