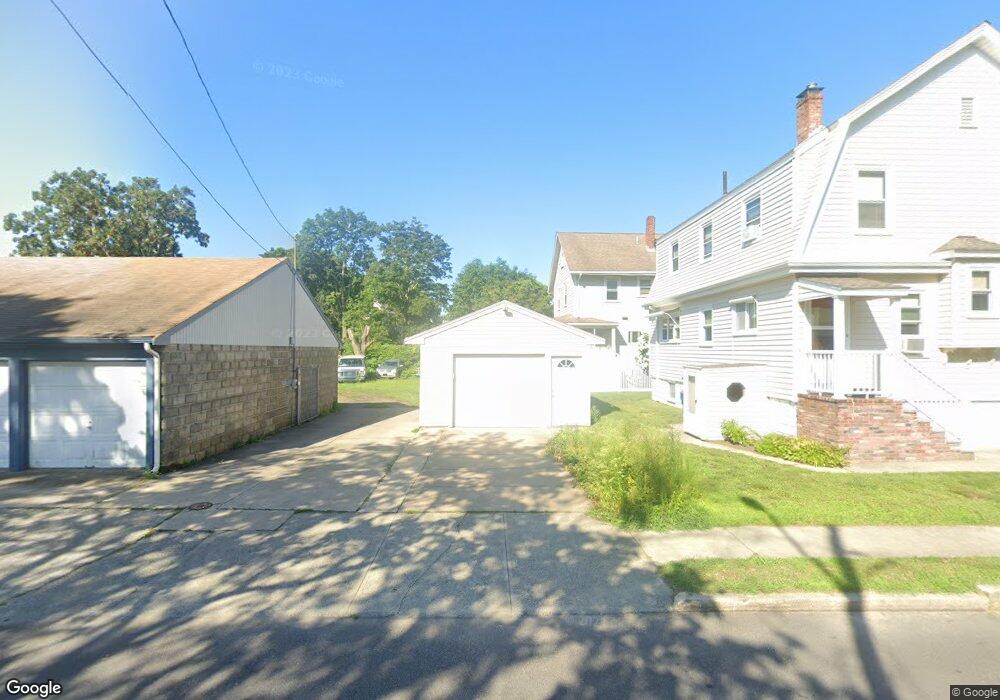
29 Linden Ave Fairhaven, MA 02719
Oxford NeighborhoodEstimated Value: $487,385 - $550,000
4
Beds
1
Bath
1,576
Sq Ft
$325/Sq Ft
Est. Value
About This Home
This home is located at 29 Linden Ave, Fairhaven, MA 02719 and is currently estimated at $512,346, approximately $325 per square foot. 29 Linden Ave is a home located in Bristol County with nearby schools including Fairhaven High School, City On A Hill Charter Public School New Bedford, and St. Joseph School.
Ownership History
Date
Name
Owned For
Owner Type
Purchase Details
Closed on
Jan 10, 2011
Sold by
Sylvia Leon S and Sylvia Elizabeth L
Bought by
Litalien Kathleen M and Sylvia Leon S
Current Estimated Value
Purchase Details
Closed on
May 3, 2006
Sold by
Litalien Kathleen M
Bought by
Sylvia Elizabeth L and Sylvia Leon S
Create a Home Valuation Report for This Property
The Home Valuation Report is an in-depth analysis detailing your home's value as well as a comparison with similar homes in the area
Home Values in the Area
Average Home Value in this Area
Purchase History
| Date | Buyer | Sale Price | Title Company |
|---|---|---|---|
| Litalien Kathleen M | -- | -- | |
| Sylvia Elizabeth L | -- | -- |
Source: Public Records
Mortgage History
| Date | Status | Borrower | Loan Amount |
|---|---|---|---|
| Previous Owner | Sylvia Elizabeth L | $65,000 | |
| Previous Owner | Sylvia Elizabeth L | $24,000 | |
| Previous Owner | Sylvia Elizabeth L | $34,000 |
Source: Public Records
Tax History Compared to Growth
Tax History
| Year | Tax Paid | Tax Assessment Tax Assessment Total Assessment is a certain percentage of the fair market value that is determined by local assessors to be the total taxable value of land and additions on the property. | Land | Improvement |
|---|---|---|---|---|
| 2025 | $36 | $382,400 | $168,700 | $213,700 |
| 2024 | $3,530 | $382,400 | $168,700 | $213,700 |
| 2023 | $3,455 | $347,200 | $147,800 | $199,400 |
| 2022 | $3,340 | $326,800 | $137,300 | $189,500 |
| 2021 | $3,213 | $284,600 | $124,200 | $160,400 |
| 2020 | $3,148 | $284,600 | $124,200 | $160,400 |
| 2019 | $3,080 | $255,400 | $103,000 | $152,400 |
| 2018 | $2,791 | $236,600 | $98,100 | $138,500 |
| 2017 | $2,744 | $227,900 | $98,100 | $129,800 |
| 2016 | $2,678 | $219,900 | $98,100 | $121,800 |
| 2015 | $2,650 | $218,100 | $98,100 | $120,000 |
Source: Public Records
Map
Nearby Homes