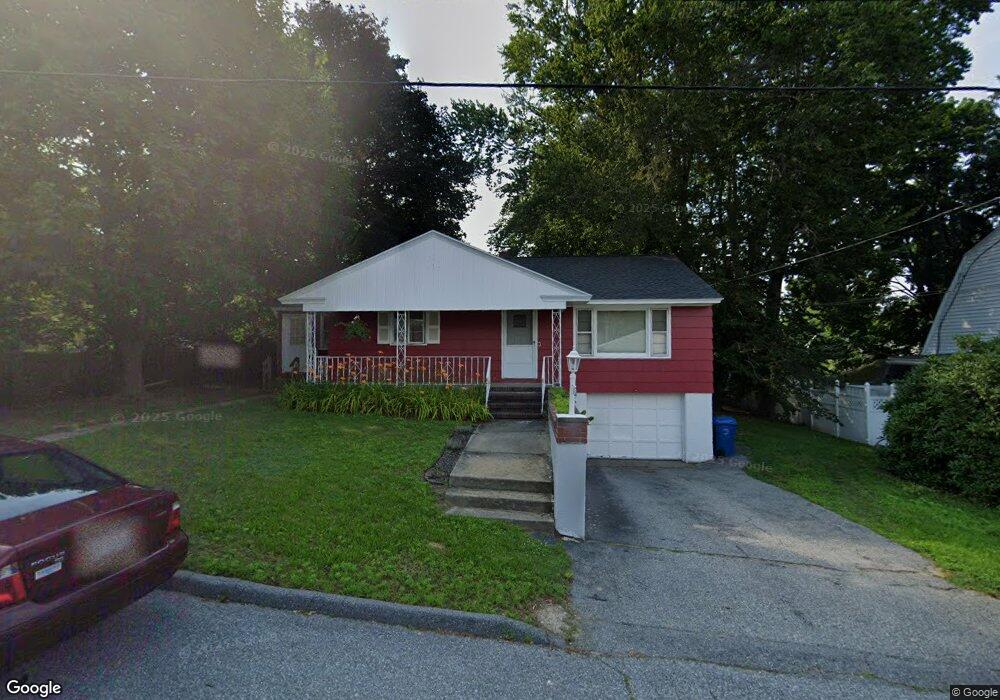
29 Linehan St Lawrence, MA 01841
Prospect Hill-Back Bay NeighborhoodEstimated Value: $441,000 - $526,923
2
Beds
1
Bath
1,008
Sq Ft
$465/Sq Ft
Est. Value
About This Home
This home is located at 29 Linehan St, Lawrence, MA 01841 and is currently estimated at $468,981, approximately $465 per square foot. 29 Linehan St is a home located in Essex County with nearby schools including Olive Branch Elementary School, James F. Hennessey School, and School For Exceptional Studies.
Ownership History
Date
Name
Owned For
Owner Type
Purchase Details
Closed on
Jun 21, 2007
Sold by
Wazlaw James H and Wazlaw Brian J
Bought by
Jones Peter Reuben and Jamison Julie L
Current Estimated Value
Home Financials for this Owner
Home Financials are based on the most recent Mortgage that was taken out on this home.
Original Mortgage
$107,500
Outstanding Balance
$65,600
Interest Rate
6.14%
Mortgage Type
Purchase Money Mortgage
Estimated Equity
$403,381
Create a Home Valuation Report for This Property
The Home Valuation Report is an in-depth analysis detailing your home's value as well as a comparison with similar homes in the area
Home Values in the Area
Average Home Value in this Area
Purchase History
| Date | Buyer | Sale Price | Title Company |
|---|---|---|---|
| Jones Peter Reuben | $222,500 | -- |
Source: Public Records
Mortgage History
| Date | Status | Borrower | Loan Amount |
|---|---|---|---|
| Open | Jones Peter Reuben | $107,500 |
Source: Public Records
Tax History Compared to Growth
Tax History
| Year | Tax Paid | Tax Assessment Tax Assessment Total Assessment is a certain percentage of the fair market value that is determined by local assessors to be the total taxable value of land and additions on the property. | Land | Improvement |
|---|---|---|---|---|
| 2025 | $3,713 | $421,900 | $166,400 | $255,500 |
| 2024 | $3,362 | $363,500 | $144,000 | $219,500 |
| 2023 | $3,766 | $370,700 | $144,000 | $226,700 |
| 2022 | $3,566 | $311,700 | $128,400 | $183,300 |
| 2021 | $3,404 | $277,400 | $128,400 | $149,000 |
| 2020 | $3,424 | $275,500 | $126,500 | $149,000 |
| 2019 | $3,192 | $233,300 | $101,100 | $132,200 |
| 2018 | $2,963 | $206,900 | $96,400 | $110,500 |
| 2017 | $2,876 | $187,500 | $88,900 | $98,600 |
| 2016 | $2,809 | $181,100 | $79,600 | $101,500 |
| 2015 | $2,496 | $165,100 | $63,600 | $101,500 |
Source: Public Records
Map
Nearby Homes
- 167 Ferry 53 Mann St Unit 2,5,6
- 68 Wesley St
- 35 Kendall St
- 9 Boylston St
- 106 Leroy Ave
- 35 Swan Ave
- 24 Boylston St
- 262 E Haverhill St Unit 4
- 15 Swan Ave
- 100-102 E Haverhill St
- 24 Court St
- 80 Ferry St Unit 80A
- 20 Knox St Unit 43
- 20 Knox St Unit 23
- 29 Meadowbrook Rd
- 65 Brook St
- 192 Union St
- 6 Brook St
- 3 Thissell St
- 63 Lippold St