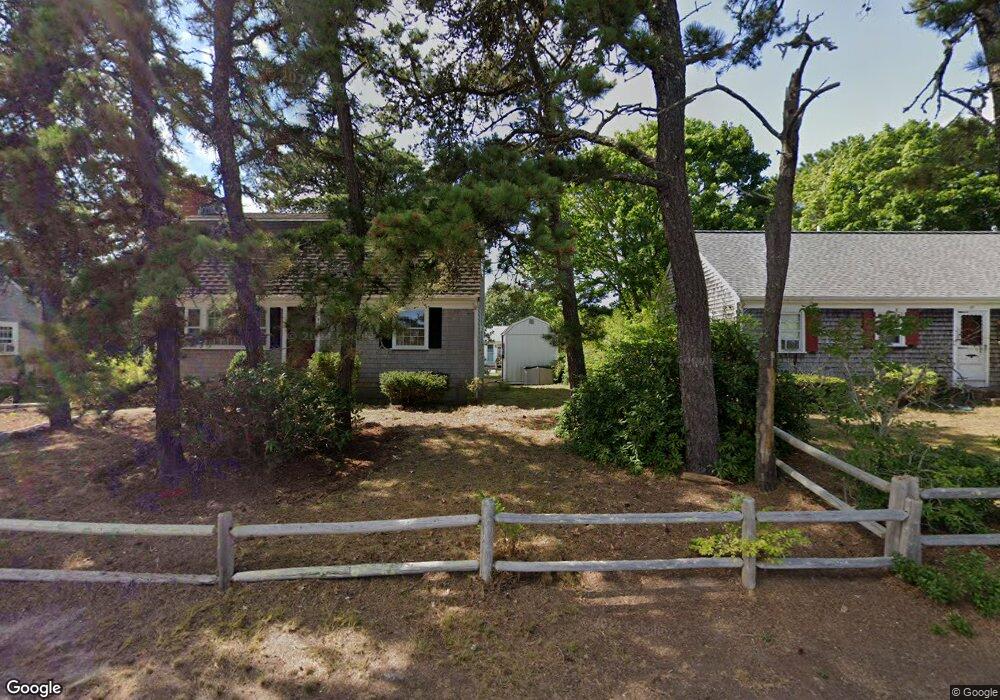
29 Lorree Ln Dennis Port, MA 02639
Dennis Port NeighborhoodEstimated Value: $528,000 - $590,970
2
Beds
1
Bath
1,000
Sq Ft
$566/Sq Ft
Est. Value
About This Home
This home is located at 29 Lorree Ln, Dennis Port, MA 02639 and is currently estimated at $565,743, approximately $565 per square foot. 29 Lorree Ln is a home located in Barnstable County with nearby schools including Dennis-Yarmouth Regional High School and St. Pius X. School.
Ownership History
Date
Name
Owned For
Owner Type
Purchase Details
Closed on
Jul 15, 2020
Sold by
Kane John W and Kane Rosemarie J
Bought by
Lorree Lane 29 Rt
Current Estimated Value
Purchase Details
Closed on
Apr 30, 2008
Sold by
Lorree Lane Rt
Bought by
Kane John W and Kane Rosemarie J
Home Financials for this Owner
Home Financials are based on the most recent Mortgage that was taken out on this home.
Original Mortgage
$233,900
Interest Rate
5.99%
Mortgage Type
Purchase Money Mortgage
Purchase Details
Closed on
Dec 30, 2004
Sold by
Crosby Jo Ann and Crosby Richard J
Bought by
Lorree Lane Rt
Home Financials for this Owner
Home Financials are based on the most recent Mortgage that was taken out on this home.
Original Mortgage
$212,000
Interest Rate
5.73%
Mortgage Type
Purchase Money Mortgage
Create a Home Valuation Report for This Property
The Home Valuation Report is an in-depth analysis detailing your home's value as well as a comparison with similar homes in the area
Home Values in the Area
Average Home Value in this Area
Purchase History
| Date | Buyer | Sale Price | Title Company |
|---|---|---|---|
| Lorree Lane 29 Rt | -- | None Available | |
| Kane John W | $259,900 | -- | |
| Lorree Lane Rt | $265,000 | -- |
Source: Public Records
Mortgage History
| Date | Status | Borrower | Loan Amount |
|---|---|---|---|
| Previous Owner | Kane John W | $233,900 | |
| Previous Owner | Lorree Lane Rt | $212,000 |
Source: Public Records
Tax History Compared to Growth
Tax History
| Year | Tax Paid | Tax Assessment Tax Assessment Total Assessment is a certain percentage of the fair market value that is determined by local assessors to be the total taxable value of land and additions on the property. | Land | Improvement |
|---|---|---|---|---|
| 2025 | $2,186 | $504,900 | $197,000 | $307,900 |
| 2024 | $2,063 | $470,000 | $189,500 | $280,500 |
| 2023 | $1,995 | $427,300 | $172,200 | $255,100 |
| 2022 | $1,931 | $344,800 | $155,100 | $189,700 |
| 2021 | $1,990 | $330,000 | $173,800 | $156,200 |
| 2020 | $1,793 | $294,000 | $152,100 | $141,900 |
| 2019 | $1,709 | $277,000 | $149,100 | $127,900 |
| 2018 | $1,646 | $259,700 | $142,000 | $117,700 |
| 2017 | $1,512 | $245,800 | $131,800 | $114,000 |
| 2016 | $1,501 | $229,900 | $142,000 | $87,900 |
| 2015 | $1,471 | $229,900 | $142,000 | $87,900 |
| 2014 | $1,311 | $206,400 | $121,700 | $84,700 |
Source: Public Records
Map
Nearby Homes
- 31 Easy St
- 22 Wixon Rd
- 80 Michaels Ave
- 19 Standish Way
- 37 Beach Hills Rd
- 22 Ferncliff Rd
- 37-A Beach Hills Rd
- 72 Bassett Ln
- 262 Old Wharf Rd Unit 67
- 262 Old Wharf Rd Unit 5
- 262 Old Wharf Rd Unit 5
- 262 Old Wharf Rd Unit 20
- 262 Old Wharf Rd Unit 87
- 64 Beaten Rd
- 37 Ocean Dr Unit 2
- 4 Coffey Ln
- 241 Old Wharf Rd Unit 82
- 241 Old Wharf Rd Unit 127
- 241 Old Wharf Rd Unit 90