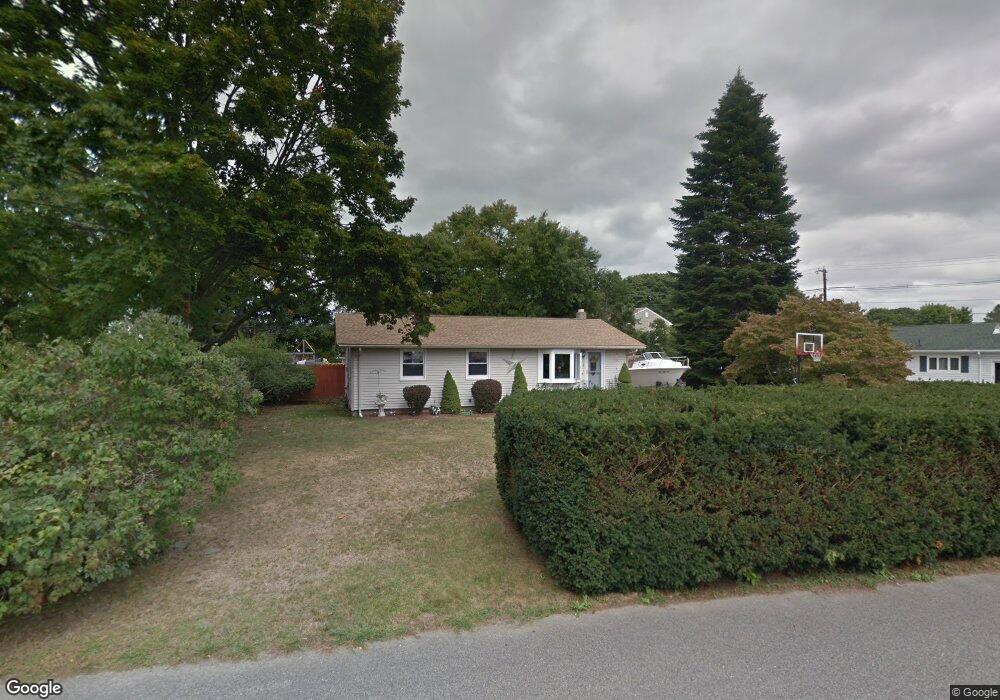
29 Mabel Dr Seekonk, MA 02771
Monroes-South Seekonk NeighborhoodEstimated Value: $433,000 - $490,000
3
Beds
1
Bath
1,408
Sq Ft
$328/Sq Ft
Est. Value
About This Home
This home is located at 29 Mabel Dr, Seekonk, MA 02771 and is currently estimated at $461,714, approximately $327 per square foot. 29 Mabel Dr is a home located in Bristol County with nearby schools including Seekonk High School, St Mary Academy-Bay View, and Providence Country Day School.
Ownership History
Date
Name
Owned For
Owner Type
Purchase Details
Closed on
Jan 6, 2003
Sold by
Lacascio Joseph E
Bought by
Pappas Stephen R and Hier Pappas Heather
Current Estimated Value
Home Financials for this Owner
Home Financials are based on the most recent Mortgage that was taken out on this home.
Original Mortgage
$164,000
Outstanding Balance
$70,270
Interest Rate
6.08%
Mortgage Type
Purchase Money Mortgage
Estimated Equity
$391,444
Purchase Details
Closed on
Jun 30, 1992
Sold by
Mullen Robert T and Mullen Tricia S
Bought by
Lacascio Joseph E and Lacascio Mary L
Home Financials for this Owner
Home Financials are based on the most recent Mortgage that was taken out on this home.
Original Mortgage
$112,290
Interest Rate
8.57%
Mortgage Type
Purchase Money Mortgage
Create a Home Valuation Report for This Property
The Home Valuation Report is an in-depth analysis detailing your home's value as well as a comparison with similar homes in the area
Home Values in the Area
Average Home Value in this Area
Purchase History
| Date | Buyer | Sale Price | Title Company |
|---|---|---|---|
| Pappas Stephen R | $205,000 | -- | |
| Lacascio Joseph E | $112,290 | -- |
Source: Public Records
Mortgage History
| Date | Status | Borrower | Loan Amount |
|---|---|---|---|
| Open | Pappas Stephen R | $164,000 | |
| Previous Owner | Lacascio Joseph E | $112,290 | |
| Previous Owner | Lacascio Joseph E | $25,000 | |
| Previous Owner | Lacascio Joseph E | $5,500 |
Source: Public Records
Tax History Compared to Growth
Tax History
| Year | Tax Paid | Tax Assessment Tax Assessment Total Assessment is a certain percentage of the fair market value that is determined by local assessors to be the total taxable value of land and additions on the property. | Land | Improvement |
|---|---|---|---|---|
| 2025 | $4,421 | $358,000 | $143,100 | $214,900 |
| 2024 | $4,213 | $341,100 | $143,100 | $198,000 |
| 2023 | $4,073 | $310,700 | $127,800 | $182,900 |
| 2022 | $3,721 | $278,900 | $122,600 | $156,300 |
| 2021 | $3,288 | $242,300 | $108,200 | $134,100 |
| 2020 | $3,125 | $237,300 | $108,400 | $128,900 |
| 2019 | $2,957 | $226,400 | $101,900 | $124,500 |
| 2018 | $2,901 | $217,300 | $99,100 | $118,200 |
| 2017 | $2,781 | $206,600 | $96,600 | $110,000 |
| 2016 | $2,638 | $196,700 | $96,600 | $100,100 |
| 2015 | $2,585 | $195,400 | $96,600 | $98,800 |
Source: Public Records
Map
Nearby Homes