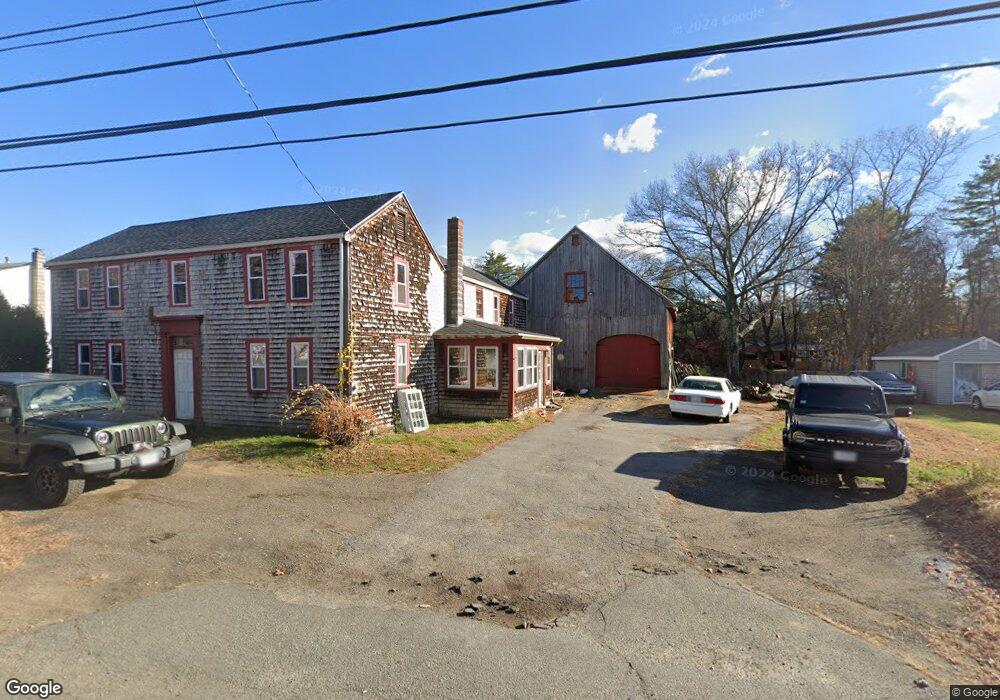
29 Main St Salisbury, MA 01952
Estimated Value: $542,079 - $765,000
6
Beds
1
Bath
2,252
Sq Ft
$288/Sq Ft
Est. Value
About This Home
This home is located at 29 Main St, Salisbury, MA 01952 and is currently estimated at $648,270, approximately $287 per square foot. 29 Main St is a home located in Essex County with nearby schools including Triton Regional High School.
Ownership History
Date
Name
Owned For
Owner Type
Purchase Details
Closed on
May 17, 2007
Sold by
Holley Jack R
Bought by
Merenda Robert A and Merenda Leeanne
Current Estimated Value
Home Financials for this Owner
Home Financials are based on the most recent Mortgage that was taken out on this home.
Original Mortgage
$170,000
Outstanding Balance
$103,462
Interest Rate
6.18%
Mortgage Type
Purchase Money Mortgage
Estimated Equity
$544,808
Purchase Details
Closed on
Mar 14, 1997
Sold by
Hr 1 A Lp
Bought by
A J Johnson Nt and Johnson Albert J
Create a Home Valuation Report for This Property
The Home Valuation Report is an in-depth analysis detailing your home's value as well as a comparison with similar homes in the area
Home Values in the Area
Average Home Value in this Area
Purchase History
| Date | Buyer | Sale Price | Title Company |
|---|---|---|---|
| Merenda Robert A | $268,000 | -- | |
| A J Johnson Nt | $115,000 | -- |
Source: Public Records
Mortgage History
| Date | Status | Borrower | Loan Amount |
|---|---|---|---|
| Open | A J Johnson Nt | $170,000 |
Source: Public Records
Tax History
| Year | Tax Paid | Tax Assessment Tax Assessment Total Assessment is a certain percentage of the fair market value that is determined by local assessors to be the total taxable value of land and additions on the property. | Land | Improvement |
|---|---|---|---|---|
| 2025 | $3,736 | $370,600 | $163,800 | $206,800 |
| 2024 | $3,801 | $363,700 | $163,800 | $199,900 |
| 2023 | $3,795 | $351,400 | $163,800 | $187,600 |
| 2022 | $3,528 | $316,700 | $147,500 | $169,200 |
| 2021 | $3,538 | $314,200 | $147,500 | $166,700 |
| 2020 | $3,525 | $307,600 | $147,500 | $160,100 |
| 2019 | $3,445 | $290,500 | $143,400 | $147,100 |
| 2018 | $3,272 | $277,800 | $132,900 | $144,900 |
| 2017 | $3,053 | $256,100 | $122,900 | $133,200 |
| 2016 | $2,941 | $252,000 | $118,800 | $133,200 |
| 2015 | $2,972 | $252,900 | $110,600 | $142,300 |
Source: Public Records
Map
Nearby Homes
- 241 & 245 Lafayette Rd
- 188 Lafayette Rd
- 6 Forest Dr
- 7 Toll Rd
- 25 Bayberry Ln
- 154 Lafayette Rd
- 167 Staples St
- 42 Kendell Ln
- 117 Whip-Poor-will St
- 176 Lower Collins St
- 69 Nashville St
- 71 Cynthia Cir
- 17 Brown Ave
- 19 Viola Cir
- 1 Learned Ln
- 57 Baker Rd
- 35 New Zealand Rd
- 64 Seabrook Rd
- 54 Rabbit Rd
- 44 Seabrook Rd
Your Personal Tour Guide
Ask me questions while you tour the home.