Estimated Value: $360,946 - $814,000
3
Beds
1
Bath
1,220
Sq Ft
$439/Sq Ft
Est. Value
About This Home
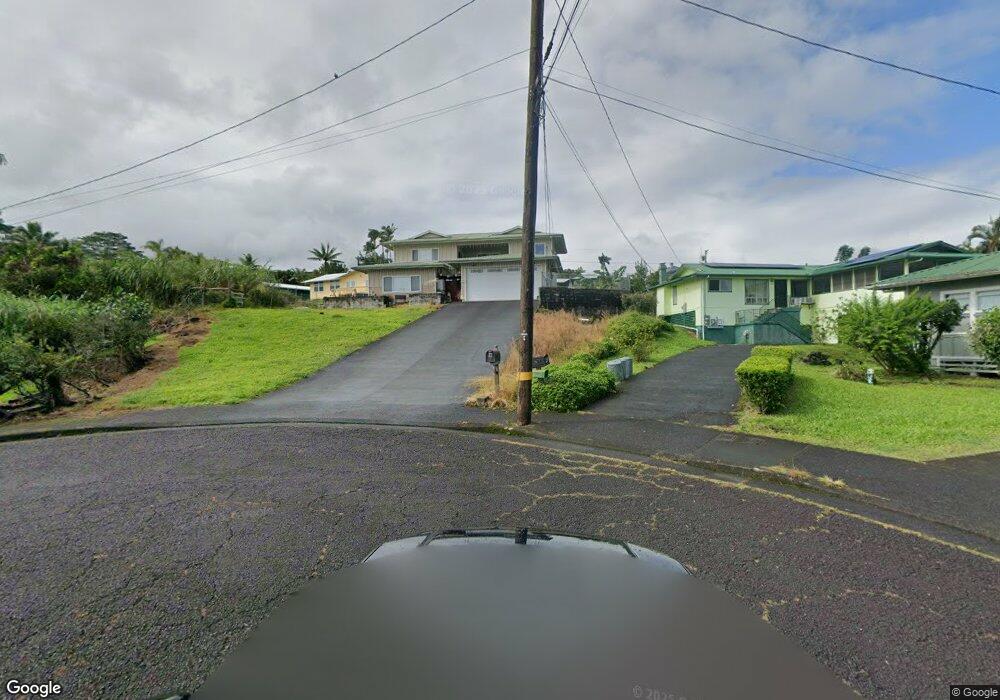
This home is located at 29 Manu Place Unit 2300A, Hilo, HI 96720 and is currently estimated at $535,315, approximately $438 per square foot. 29 Manu Place Unit 2300A is a home located in Hawaii County with nearby schools including Ernest Bowen de Silva Elementary School, Hilo Intermediate School, and Hilo High School.
Ownership History
Date
Name
Owned For
Owner Type
Purchase Details
Closed on
Aug 4, 2021
Sold by
Hart Molly
Bought by
Hart Molly and Molly Hart Revocable Trust
Current Estimated Value
Purchase Details
Closed on
Aug 23, 2019
Sold by
Whitington Dale H and Hart Molly
Bought by
Hart Molly
Home Financials for this Owner
Home Financials are based on the most recent Mortgage that was taken out on this home.
Original Mortgage
$130,000
Outstanding Balance
$113,620
Interest Rate
3.6%
Mortgage Type
New Conventional
Estimated Equity
$421,695
Purchase Details
Closed on
Oct 19, 2015
Sold by
Wharton Jennifer
Bought by
Whittington Dale H and Hart Molly
Home Financials for this Owner
Home Financials are based on the most recent Mortgage that was taken out on this home.
Original Mortgage
$135,862
Interest Rate
3.87%
Mortgage Type
New Conventional
Create a Home Valuation Report for This Property
The Home Valuation Report is an in-depth analysis detailing your home's value as well as a comparison with similar homes in the area
Home Values in the Area
Average Home Value in this Area
Purchase History
| Date | Buyer | Sale Price | Title Company |
|---|---|---|---|
| Hart Molly | -- | None Available | |
| Hart Molly | $63,800 | Amrock | |
| Whittington Dale H | $181,500 | Fam |
Source: Public Records
Mortgage History
| Date | Status | Borrower | Loan Amount |
|---|---|---|---|
| Open | Hart Molly | $130,000 | |
| Previous Owner | Whittington Dale H | $135,862 |
Source: Public Records
Tax History Compared to Growth
Tax History
| Year | Tax Paid | Tax Assessment Tax Assessment Total Assessment is a certain percentage of the fair market value that is determined by local assessors to be the total taxable value of land and additions on the property. | Land | Improvement |
|---|---|---|---|---|
| 2025 | $298 | $206,100 | $106,900 | $99,200 |
| 2024 | $298 | $200,100 | $106,900 | $93,200 |
| 2023 | $279 | $194,300 | $106,900 | $87,400 |
| 2022 | $313 | $188,600 | $106,900 | $81,700 |
| 2021 | $286 | $183,100 | $106,900 | $76,200 |
| 2020 | $644 | $255,900 | $183,100 | $72,800 |
| 2019 | $2,380 | $214,400 | $143,000 | $71,400 |
| 2018 | $2,317 | $208,700 | $144,400 | $64,300 |
| 2017 | $2,145 | $193,200 | $131,300 | $61,900 |
| 2016 | $1,801 | $179,200 | $131,300 | $47,900 |
| 2015 | -- | $255,600 | $196,900 | $58,700 |
| 2014 | -- | $254,400 | $196,900 | $57,500 |
Source: Public Records
Map
Nearby Homes
- 24 Manu Place
- 0 Kukuau St Unit 721423
- 61 Pakalana St
- 956 Kaumana Dr
- 497 Makanaa St
- 7 Kaapuni Loop
- 25 Wawai Loop
- 52 Wawai Loop
- 901 Kukuau St
- 883 Hele Mauna St
- 1162 Kaumana Dr
- 144 Chong St
- 161 Uluwai St
- 187 Hokulani St
- 105 Lahaina St
- 27 Uluwai St
- 617 Ainako Ave Unit 1
- 199 Kaumana Dr
- 1360 Kaumana Dr
- 28 S Wiliwili St
- 30 Mokihana St
- 10 Manu Place
- 4 Manu Place
- 18 Mokihana St Unit 4620
- 18 Mokihana St Unit 4636
- 18 Mokihana St Unit 4668
- 18 Mokihana St
- 36 Mokihana St
- 55 Manu Place Unit 525
- 55 Manu Place Unit 521
- 55 Manu Place Unit 519
- 55 Manu Place Unit 515
- 55 Manu Place Unit 513
- 55 Manu Place Unit 512
- 55 Manu Place Unit 520
- 55 Manu Place Unit 524
- 16 Manu Place
- 15 Manu Place
- 0 Mokihana St
- 20 Manu Place