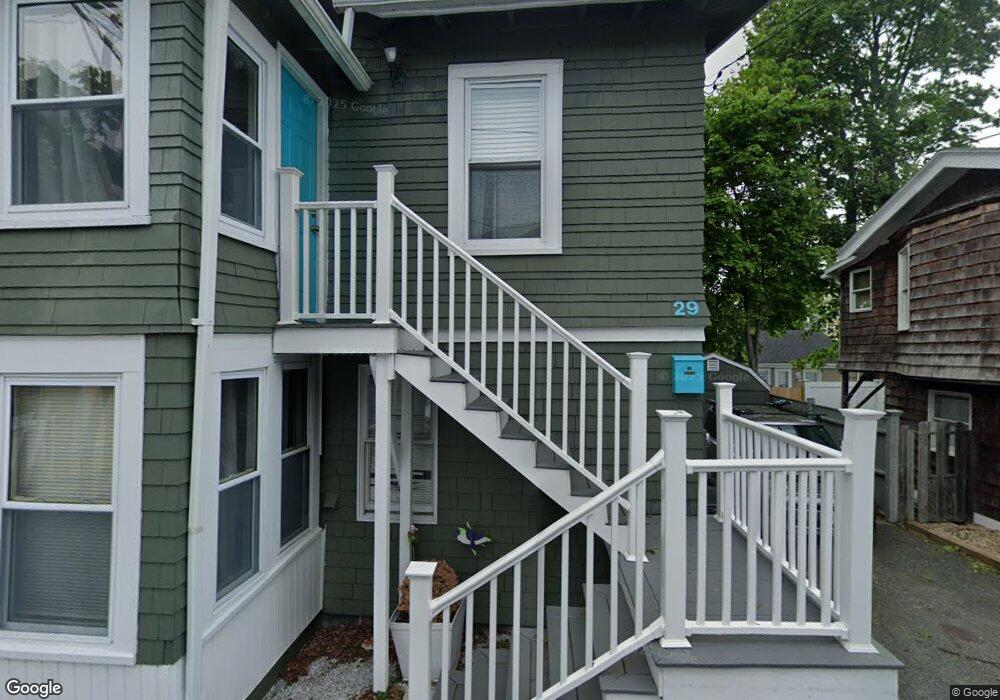
29 Maple Ave Nahant, MA 01908
Estimated Value: $769,147 - $896,000
4
Beds
2
Baths
1,583
Sq Ft
$520/Sq Ft
Est. Value
About This Home
This home is located at 29 Maple Ave, Nahant, MA 01908 and is currently estimated at $823,037, approximately $519 per square foot. 29 Maple Ave is a home located in Essex County with nearby schools including Johnson Elementary School, Swampscott Middle School, and Swampscott High School.
Ownership History
Date
Name
Owned For
Owner Type
Purchase Details
Closed on
Nov 14, 2022
Sold by
Ballantine Rt and Ballantine
Bought by
Cronin Jay and Cronin Supranee
Current Estimated Value
Home Financials for this Owner
Home Financials are based on the most recent Mortgage that was taken out on this home.
Original Mortgage
$693,550
Outstanding Balance
$670,517
Interest Rate
6.92%
Mortgage Type
Purchase Money Mortgage
Estimated Equity
$152,520
Purchase Details
Closed on
Jun 28, 2017
Sold by
Ballantine John J and Ballantine Lori K
Bought by
Ballantine John J and Ballantine Lori K
Purchase Details
Closed on
Jul 29, 2005
Sold by
Casale Lisa and Fitzpatrick Lisa
Bought by
Ballantine John K
Home Financials for this Owner
Home Financials are based on the most recent Mortgage that was taken out on this home.
Original Mortgage
$346,000
Interest Rate
5.67%
Mortgage Type
Purchase Money Mortgage
Purchase Details
Closed on
Nov 17, 1994
Sold by
Powers Roberta and Powers Deborah
Bought by
Casale Lisa
Purchase Details
Closed on
Sep 16, 1991
Sold by
Boston Five Cents Sb
Bought by
Powers Roberta L and Deborah J Powers
Purchase Details
Closed on
Apr 25, 1988
Sold by
Moccia Joseph E
Bought by
Savage Robert J
Purchase Details
Closed on
Jan 6, 1988
Sold by
Ambery Mary E
Bought by
Moccia Joseph
Create a Home Valuation Report for This Property
The Home Valuation Report is an in-depth analysis detailing your home's value as well as a comparison with similar homes in the area
Home Values in the Area
Average Home Value in this Area
Purchase History
| Date | Buyer | Sale Price | Title Company |
|---|---|---|---|
| Cronin Jay | $715,000 | None Available | |
| Ballantine John J | -- | -- | |
| Ballantine John J | -- | -- | |
| Ballantine John K | $432,500 | -- | |
| Ballantine John K | $432,500 | -- | |
| Casale Lisa | $154,500 | -- | |
| Casale Lisa | $154,500 | -- | |
| Powers Roberta L | $144,400 | -- | |
| Boston 5C Sb | $136,800 | -- | |
| Powers Roberta L | $144,400 | -- | |
| Savage Robert J | $215,000 | -- | |
| Moccia Joseph | $155,000 | -- |
Source: Public Records
Mortgage History
| Date | Status | Borrower | Loan Amount |
|---|---|---|---|
| Open | Cronin Jay | $693,550 | |
| Previous Owner | Moccia Joseph | $42,734 | |
| Previous Owner | Moccia Joseph | $346,000 |
Source: Public Records
Tax History
| Year | Tax Paid | Tax Assessment Tax Assessment Total Assessment is a certain percentage of the fair market value that is determined by local assessors to be the total taxable value of land and additions on the property. | Land | Improvement |
|---|---|---|---|---|
| 2025 | $6,149 | $672,000 | $308,600 | $363,400 |
| 2024 | $5,509 | $607,400 | $270,000 | $337,400 |
| 2023 | $4,949 | $544,400 | $254,600 | $289,800 |
| 2022 | $5,025 | $513,300 | $246,900 | $266,400 |
| 2021 | $4,906 | $466,800 | $231,500 | $235,300 |
| 2020 | $4,945 | $450,800 | $216,000 | $234,800 |
| 2019 | $4,411 | $404,300 | $200,600 | $203,700 |
| 2018 | $3,907 | $381,200 | $177,500 | $203,700 |
| 2017 | $3,991 | $381,200 | $177,500 | $203,700 |
| 2016 | $3,523 | $334,900 | $131,200 | $203,700 |
| 2015 | $3,585 | $328,300 | $124,600 | $203,700 |
| 2014 | $3,622 | $328,400 | $124,600 | $203,800 |
Source: Public Records
Map
Nearby Homes
- 30 Sherman Ave
- 1 Goddard Dr
- 183 Bass Point Rd
- 9 Little Nahant Rd
- 66 Ocean St
- 162 Willow Rd Unit 11
- 51 Cliff St
- 1 Carey Cir Unit 409
- 191 N Shore Rd
- 11 Archer Ave
- 123 Mills Ave
- 31 Mills Ave
- 510 Revere Beach Blvd Unit 1205
- 510 Revere Beach Blvd Unit 905
- 505 Revere Beach Blvd Unit 303
- 474 Revere Beach Blvd Unit 501
- 474 Revere Beach Blvd Unit 903
- 474 Revere Beach Blvd Unit 302
- 474 Revere Beach Blvd Unit 403
- 98 Lynnway
Your Personal Tour Guide
Ask me questions while you tour the home.