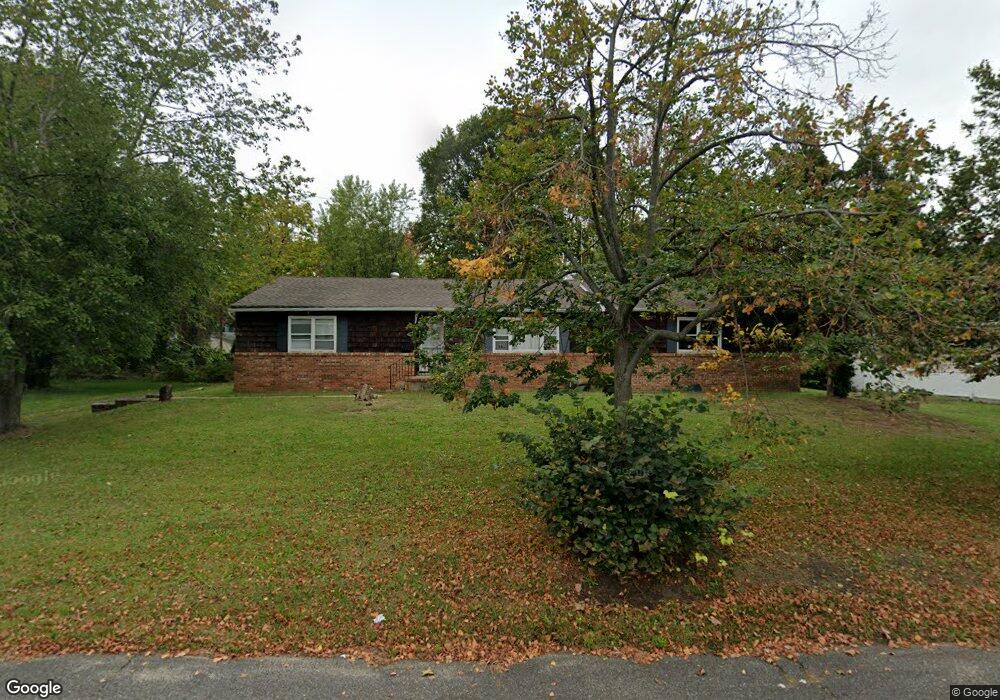
29 Maple Place Keyport, NJ 07735
Estimated Value: $509,000 - $554,000
2
Beds
2
Baths
1,383
Sq Ft
$386/Sq Ft
Est. Value
About This Home
This home is located at 29 Maple Place, Keyport, NJ 07735 and is currently estimated at $534,111, approximately $386 per square foot. 29 Maple Place is a home located in Monmouth County with nearby schools including Keyport Central School, Keyport High School, and Icob Academy.
Ownership History
Date
Name
Owned For
Owner Type
Purchase Details
Closed on
Feb 23, 2012
Sold by
Malloy John and Malloy Michael A
Bought by
Malloy John
Current Estimated Value
Home Financials for this Owner
Home Financials are based on the most recent Mortgage that was taken out on this home.
Original Mortgage
$194,586
Outstanding Balance
$23,039
Interest Rate
3.5%
Mortgage Type
FHA
Estimated Equity
$511,072
Purchase Details
Closed on
Jul 28, 2011
Sold by
Crawford Dana Allen
Bought by
Malloy John and Malloy Michael A
Home Financials for this Owner
Home Financials are based on the most recent Mortgage that was taken out on this home.
Original Mortgage
$209,948
Interest Rate
4.75%
Mortgage Type
FHA
Purchase Details
Closed on
Oct 31, 2009
Sold by
Jackson Patricia
Bought by
Crawford Dana Allen
Home Financials for this Owner
Home Financials are based on the most recent Mortgage that was taken out on this home.
Original Mortgage
$213,069
Interest Rate
4.98%
Mortgage Type
FHA
Create a Home Valuation Report for This Property
The Home Valuation Report is an in-depth analysis detailing your home's value as well as a comparison with similar homes in the area
Home Values in the Area
Average Home Value in this Area
Purchase History
| Date | Buyer | Sale Price | Title Company |
|---|---|---|---|
| Malloy John | -- | Stewart Title Guaranty Co | |
| Malloy John | $247,000 | Red Bank Title Agency Inc | |
| Crawford Dana Allen | $217,000 | Red Bank Title Agency Inc |
Source: Public Records
Mortgage History
| Date | Status | Borrower | Loan Amount |
|---|---|---|---|
| Open | Malloy John | $194,586 | |
| Closed | Malloy John | $209,948 | |
| Previous Owner | Crawford Dana Allen | $213,069 |
Source: Public Records
Tax History
| Year | Tax Paid | Tax Assessment Tax Assessment Total Assessment is a certain percentage of the fair market value that is determined by local assessors to be the total taxable value of land and additions on the property. | Land | Improvement |
|---|---|---|---|---|
| 2025 | $8,352 | $444,800 | $238,800 | $206,000 |
| 2024 | $8,216 | $403,500 | $207,700 | $195,800 |
Source: Public Records
Map
Nearby Homes
- 6 Octavia Place
- 226 Osborn St
- 72 Manchester Ave
- 9 Hurley St
- 74 Manchester Ave
- 104 Church St
- 87 Church St
- 231 Atlantic St Unit 23
- 231 Atlantic St Unit 83
- 40 Church St
- 162 2nd St
- 75 Broad St
- 55 E Front St
- 37 Myrtle Ave
- 9 Kearney St Unit A
- 2108 Florence Ave
- 8 Pine Creek Village
- 121-123 Stone Rd
- 2 Chingarora Ave
- 95 Broadway
- 27 Maple Place
- 25 Maple Place
- 114 Maple Place
- 112 Maple Place
- 20 Maple Place
- 108 Maple Place
- 110 Maple Place
- 131 Atlantic St Unit 6
- 131 Atlantic St
- 18 Maple Place
- 139 Atlantic St
- 23 Maple Place
- 106 Maple Place
- 16 Maple Place
- 135 Atlantic St
- 137 Atlantic St
- 104 Maple Place
- 14 Maple Place
- 15 Van Dorn St
- 133 Atlantic St
Your Personal Tour Guide
Ask me questions while you tour the home.