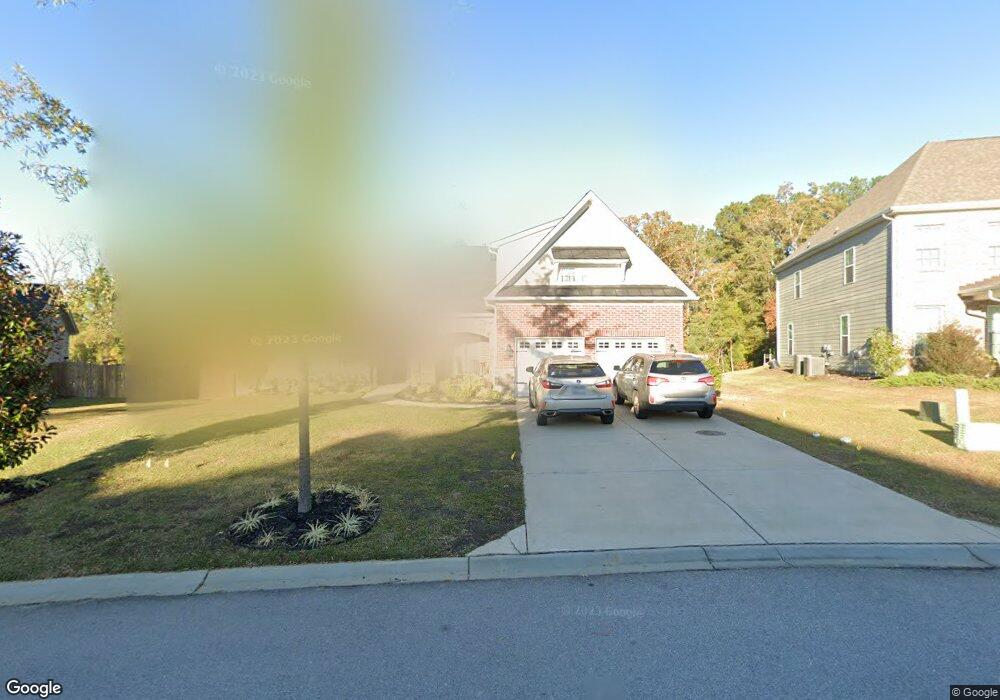
29 Mapleline Ct Chapin, SC 29036
Estimated Value: $430,685 - $496,000
3
Beds
3
Baths
2,511
Sq Ft
$182/Sq Ft
Est. Value
About This Home
This home is located at 29 Mapleline Ct, Chapin, SC 29036 and is currently estimated at $456,921, approximately $181 per square foot. 29 Mapleline Ct is a home located in Richland County with nearby schools including Lake Murray Elementary School, Chapin Intermediate, and Chapin High School.
Ownership History
Date
Name
Owned For
Owner Type
Purchase Details
Closed on
Jan 14, 2016
Sold by
Exit 97 Llc
Bought by
Portrait Hill Developers Llc
Current Estimated Value
Home Financials for this Owner
Home Financials are based on the most recent Mortgage that was taken out on this home.
Original Mortgage
$275,793
Outstanding Balance
$219,487
Interest Rate
3.98%
Mortgage Type
New Conventional
Estimated Equity
$237,434
Purchase Details
Closed on
Dec 30, 2015
Sold by
Mungo Homes Inc
Bought by
Williams Vicki V and Williams William A
Home Financials for this Owner
Home Financials are based on the most recent Mortgage that was taken out on this home.
Original Mortgage
$275,793
Outstanding Balance
$219,487
Interest Rate
3.98%
Mortgage Type
New Conventional
Estimated Equity
$237,434
Purchase Details
Closed on
Nov 2, 2015
Sold by
Mungo Homes Inc
Bought by
Ee Residential Properties Llc
Home Financials for this Owner
Home Financials are based on the most recent Mortgage that was taken out on this home.
Original Mortgage
$275,793
Outstanding Balance
$219,487
Interest Rate
3.98%
Mortgage Type
New Conventional
Estimated Equity
$237,434
Purchase Details
Closed on
Oct 14, 2014
Sold by
Exit 97 Llc
Bought by
Portrait Hill Developers Llc
Create a Home Valuation Report for This Property
The Home Valuation Report is an in-depth analysis detailing your home's value as well as a comparison with similar homes in the area
Home Values in the Area
Average Home Value in this Area
Purchase History
| Date | Buyer | Sale Price | Title Company |
|---|---|---|---|
| Portrait Hill Developers Llc | -- | -- | |
| Williams Vicki V | $119,096 | -- | |
| Mungo Homes Inc | -- | -- | |
| Ee Residential Properties Llc | -- | -- | |
| Mungo Homes Inc | -- | -- | |
| Portrait Hill Developers Llc | -- | -- |
Source: Public Records
Mortgage History
| Date | Status | Borrower | Loan Amount |
|---|---|---|---|
| Open | Williams Vicki V | $275,793 |
Source: Public Records
Tax History Compared to Growth
Tax History
| Year | Tax Paid | Tax Assessment Tax Assessment Total Assessment is a certain percentage of the fair market value that is determined by local assessors to be the total taxable value of land and additions on the property. | Land | Improvement |
|---|---|---|---|---|
| 2024 | $1,955 | $267,100 | $0 | $0 |
| 2023 | $1,879 | $9,292 | $0 | $0 |
| 2022 | $1,589 | $232,300 | $50,000 | $182,300 |
| 2021 | $1,598 | $9,290 | $0 | $0 |
| 2020 | $1,669 | $9,290 | $0 | $0 |
| 2019 | $1,649 | $9,290 | $0 | $0 |
| 2018 | $1,789 | $11,260 | $0 | $0 |
| 2017 | $1,743 | $11,260 | $0 | $0 |
| 2016 | $1,734 | $11,260 | $0 | $0 |
Source: Public Records
Map
Nearby Homes
- 1115 Portrait Hill Dr
- 442 Maria Posada Ct
- 3691 Kennerly Rd
- 133 Monroe Preserve Ln
- 114 Monroe Preserve Ln
- 109 Monroe Preserve Ln
- 149 Monroe Preserve Ln
- 145 Monroe Preserve Ln
- 105 Monroe Preserve Ln
- 117 Monroe Preserve Ln
- 110 Monroe Preserve Ln
- 113 Monroe Preserve Ln
- 0 Mt Olivet Church Rd Unit 617090
- 1511 Pet Sites Rd
- 11437 Broad River
- 756 Kimsey Dr
- 100 Stone Hill Rd
- 816 Burnview Ln
- 947 Stradley Ln
- 636 Clover View Rd
- 33 Mapleline Ct
- 23 Mapleline Ct
- 19 Mapleline Ct
- 39 Mapleline Ct
- 38 Mapleline Ct
- 20 Maplieline Ct
- 5 Maplieline Ct
- 13 Mapleline Ct
- 14 Mapleline Ct
- 41 Mapleline Ct
- 42 Mapleline Ct
- 2144 Harvestwood Ln
- 2114 Harvestwood Ln
- 5 Mapleline Ct
- 5 Mapleline Ct
- 44 Mapleline Ct
- 2156 Harvestwood Ln
- 2130 Harvestwood Ln
- 8 Mapleline Ct
- 65 Wynterhall Ct