Estimated Value: $237,872 - $322,000
--
Bed
--
Bath
1,790
Sq Ft
$165/Sq Ft
Est. Value
About This Home
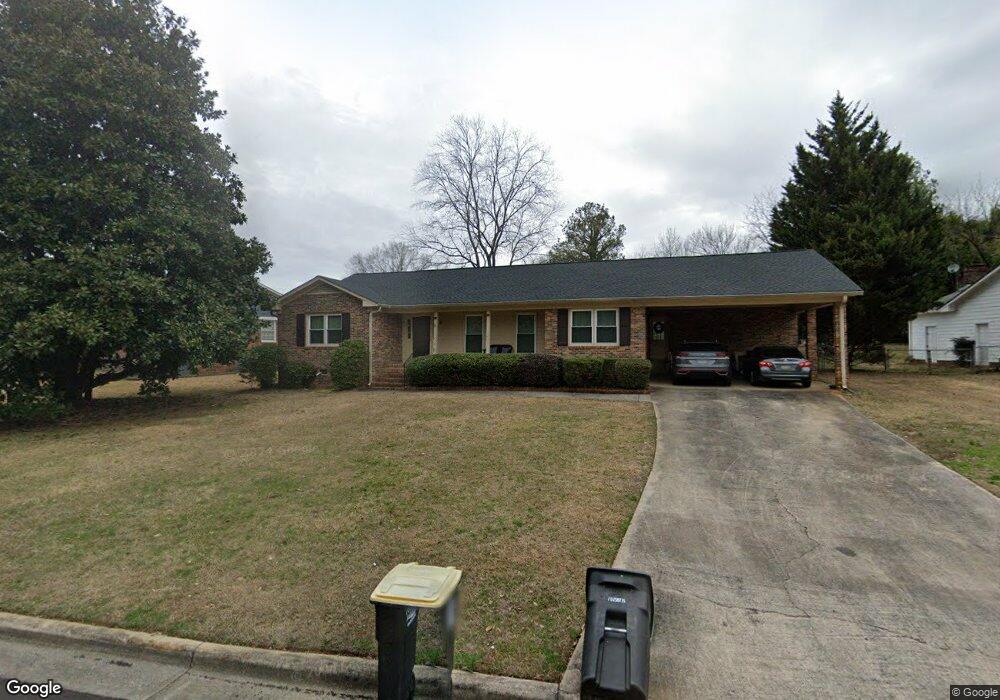
This home is located at 29 Maplewood Square SE, Rome, GA 30161 and is currently estimated at $295,468, approximately $165 per square foot. 29 Maplewood Square SE is a home located in Floyd County with nearby schools including Rome High School, St. Mary School, and Darlington School.
Ownership History
Date
Name
Owned For
Owner Type
Purchase Details
Closed on
Dec 14, 1992
Sold by
Gray Phillip N
Bought by
Gray Edith B
Current Estimated Value
Purchase Details
Closed on
May 9, 1989
Sold by
Hanson Frank
Bought by
Gray Phillip N
Purchase Details
Closed on
May 6, 1988
Sold by
Hanson Frank and Ollie Hanson
Bought by
Hanson Frank
Purchase Details
Closed on
Jul 1, 1981
Sold by
Chambless Chambless E and Chambless Patrise L
Bought by
Hanson Frank and Ollie Hanson
Purchase Details
Closed on
Jun 26, 1978
Sold by
Edgar Alacia Bussey
Bought by
Chambless Chambless E and Chambless Patrise L
Purchase Details
Closed on
Apr 17, 1976
Bought by
P and R
Purchase Details
Closed on
Apr 16, 1976
Sold by
Edgar Spencer G
Bought by
Edgar Alacia Bussey
Purchase Details
Closed on
Jan 1, 1973
Sold by
Jim Covington & Co
Bought by
Edgar Spencer G
Purchase Details
Closed on
Jan 1, 1972
Sold by
Howell Adrian
Bought by
Jim Covington & Co
Purchase Details
Closed on
Jan 2, 1971
Sold by
Howell Howell and Howell Covington
Bought by
Howell Adrian
Purchase Details
Closed on
Jan 1, 1971
Sold by
Williams Const Co
Bought by
Howell Howell and Howell Covington
Purchase Details
Closed on
Jan 1, 1968
Sold by
Howell Howell and Howell Covington
Bought by
Williams Const Co
Purchase Details
Closed on
Jan 1, 1967
Bought by
Howell Howell and Howell Covington
Create a Home Valuation Report for This Property
The Home Valuation Report is an in-depth analysis detailing your home's value as well as a comparison with similar homes in the area
Home Values in the Area
Average Home Value in this Area
Purchase History
| Date | Buyer | Sale Price | Title Company |
|---|---|---|---|
| Gray Edith B | $80,000 | -- | |
| Gray Phillip N | $68,900 | -- | |
| Hanson Frank | -- | -- | |
| Hanson Frank | $50,800 | -- | |
| Chambless Chambless E | $39,000 | -- | |
| P | -- | -- | |
| Edgar Alacia Bussey | -- | -- | |
| Edgar Spencer G | -- | -- | |
| Jim Covington & Co | $1,400 | -- | |
| Howell Adrian | -- | -- | |
| Howell Howell | -- | -- | |
| Williams Const Co | -- | -- | |
| Howell Howell | -- | -- |
Source: Public Records
Tax History Compared to Growth
Tax History
| Year | Tax Paid | Tax Assessment Tax Assessment Total Assessment is a certain percentage of the fair market value that is determined by local assessors to be the total taxable value of land and additions on the property. | Land | Improvement |
|---|---|---|---|---|
| 2024 | $3,081 | $80,757 | $12,278 | $68,479 |
| 2023 | $2,860 | $78,053 | $11,127 | $66,926 |
| 2022 | $2,396 | $65,651 | $9,208 | $56,443 |
| 2021 | $2,185 | $58,882 | $9,208 | $49,674 |
| 2020 | $2,045 | $54,661 | $7,098 | $47,563 |
| 2019 | $1,941 | $52,440 | $7,098 | $45,342 |
| 2018 | $1,855 | $50,109 | $7,098 | $43,011 |
| 2017 | $1,875 | $50,643 | $7,098 | $43,545 |
| 2016 | $1,857 | $50,000 | $7,080 | $42,920 |
| 2015 | $1,766 | $50,720 | $7,080 | $43,640 |
| 2014 | $1,766 | $50,351 | $7,080 | $43,271 |
Source: Public Records
Map
Nearby Homes
- 26 Maplewood Square SE
- 22 Oakfield Dr SE
- 20 Mitchell Cir SE
- 4 Mitchell Cir SE
- 14 Laurchris Dr SE
- 100 Valley Brook Dr SE
- 227 W Lakeshore Dr SE
- 9 Heather Rd SE
- 0 Lakeshore Dr
- 11 Surrey Trail SE
- 6 Woodland Dr SE
- 4 Coach Trail SE
- 120 Keown Rd SE
- 15 Mimosa Dr SE
- 226 Maplecrest Ln SE
- 11 Breckenridge Rd SE
- 13 Breckenridge Rd SE
- 0 Georgia 293
- 8 Covey Rise Dr SE
- 27 Maplewood Square SE
- 31 Maplewood Square SE
- 0 Maplewood Square SE Unit 8214816
- 0 Maplewood Square SE Unit 8093502
- 0 Maplewood Square SE Unit 8035883
- 0 Maplewood Square SE Unit 8612968
- 0 Maplewood Square SE Unit 8718009
- 0 Maplewood Square SE Unit 9077103
- 0 Maplewood Square SE Unit 8939866
- 0 Maplewood Square SE Unit 3224578
- 33 Maplewood Square SE
- 25 Maplewood Square SE
- 23 Maplewood Square SE
- 17 Maplewood Square SE
- 34 Maplewood Square SE
- 15 Maplewood Square SE
- 36 Maplewood Square SE
- 32 Maplewood Square SE Unit 16
- 32 Maplewood Square SE
- 35 Maplewood Square SE