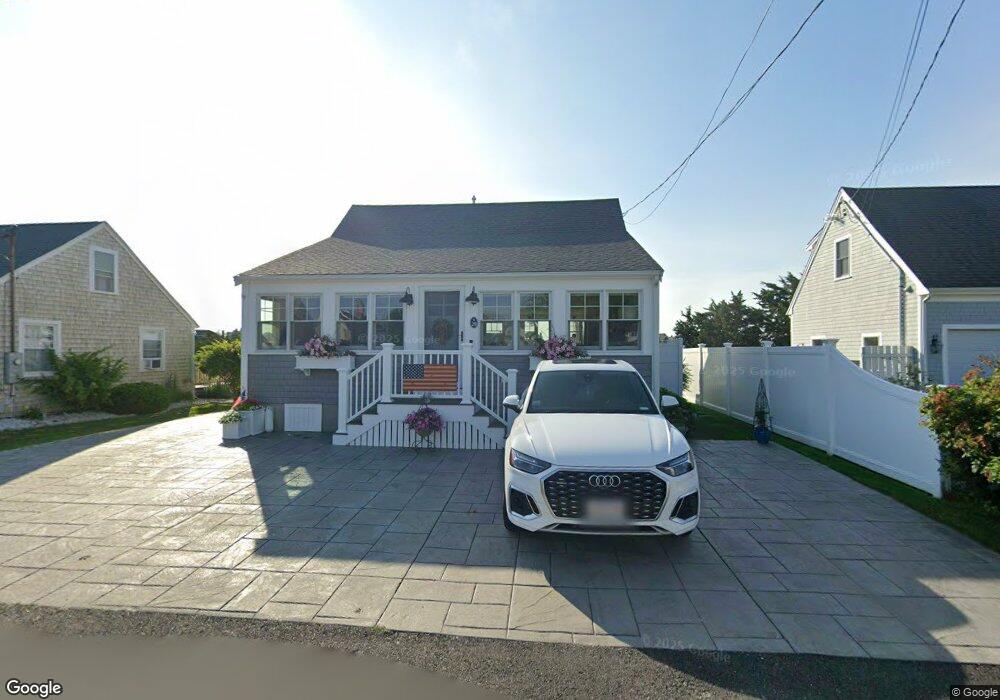
29 Marion St Marshfield, MA 02050
Green Harbor-Cedar Crest NeighborhoodEstimated Value: $645,025 - $759,000
2
Beds
2
Baths
1,050
Sq Ft
$656/Sq Ft
Est. Value
About This Home
This home is located at 29 Marion St, Marshfield, MA 02050 and is currently estimated at $688,506, approximately $655 per square foot. 29 Marion St is a home with nearby schools including Governor Edward Winslow School, Furnace Brook Middle School, and Marshfield High School.
Ownership History
Date
Name
Owned For
Owner Type
Purchase Details
Closed on
Oct 4, 2021
Sold by
Hocking William and Hocking Johanne
Bought by
Hocking Ft and Hocking
Current Estimated Value
Purchase Details
Closed on
Jul 21, 2017
Sold by
Miles John T and Miles Kathleen M
Bought by
Hocking William and Hocking Johanne
Create a Home Valuation Report for This Property
The Home Valuation Report is an in-depth analysis detailing your home's value as well as a comparison with similar homes in the area
Home Values in the Area
Average Home Value in this Area
Purchase History
| Date | Buyer | Sale Price | Title Company |
|---|---|---|---|
| Hocking Ft | -- | None Available | |
| Hocking Ft | -- | None Available | |
| Hocking William | $355,000 | -- |
Source: Public Records
Tax History
| Year | Tax Paid | Tax Assessment Tax Assessment Total Assessment is a certain percentage of the fair market value that is determined by local assessors to be the total taxable value of land and additions on the property. | Land | Improvement |
|---|---|---|---|---|
| 2025 | $5,670 | $572,700 | $317,600 | $255,100 |
| 2024 | $5,441 | $523,700 | $297,800 | $225,900 |
| 2023 | $5,106 | $463,200 | $268,000 | $195,200 |
| 2022 | $5,106 | $394,300 | $228,300 | $166,000 |
| 2021 | $4,871 | $369,300 | $218,400 | $150,900 |
| 2020 | $3,902 | $292,700 | $188,600 | $104,100 |
| 2019 | $3,828 | $286,100 | $188,600 | $97,500 |
| 2018 | $3,490 | $261,000 | $188,600 | $72,400 |
| 2017 | $3,328 | $242,600 | $178,700 | $63,900 |
| 2016 | $3,228 | $232,600 | $168,700 | $63,900 |
| 2015 | $3,091 | $232,600 | $168,700 | $63,900 |
| 2014 | $3,091 | $232,600 | $168,700 | $63,900 |
Source: Public Records
Map
Nearby Homes
- 106 Careswell St
- 71 Gurnet Rd
- 27 Ocean St
- 116 Island St
- 122 June St
- 17 Dyke Rd
- 78 Tower Ave
- 116 Outlook Rd
- 32 Gratto Rd
- 86 Barouche Dr
- 236 Powder Point Ave
- 387 Lot 2A Old Cove Rd
- 387 Lot 3A Old Cove Rd
- 387 Lot 4A Old Cove Rd
- 42 Carr Rd
- 30 Chandler Dr
- 85 Constitution Rd
- 38 Winthrop Dr
- 7 Pierce Rd
- 242 Enterprise St
Your Personal Tour Guide
Ask me questions while you tour the home.