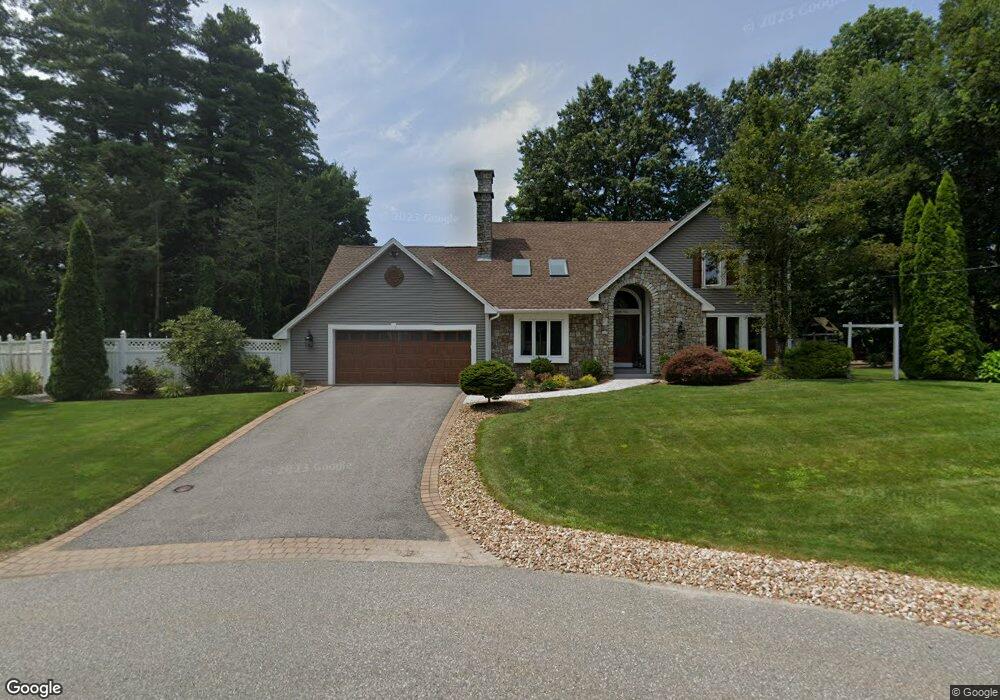
29 Mason Dr Salem, NH 03079
Salem AreaEstimated Value: $714,000 - $904,000
About This Home
This home is located at 29 Mason Dr, Salem, NH 03079 and is currently estimated at $797,333, approximately $242 per square foot. 29 Mason Dr is a home located in Rockingham County with nearby schools including Mary A. Fisk Elementary School, Woodbury School, and Salem High School.
Ownership History
We collect this data history from publicly available records. To have your information removed, we recommend requesting removal directly through your county’s website.
Purchase Details
Purchase History
We collect this data history from publicly available records. To have your information removed, we recommend requesting removal directly through your county’s website.
| Date | Buyer | Sale Price | Title Company |
|---|---|---|---|
| $405,000 | -- |
Mortgage History
We collect this data history from publicly available records. To have your information removed, we recommend requesting removal directly through your county’s website.
| Date | Status | Borrower | Loan Amount |
|---|---|---|---|
| Open | $170,000 | ||
| Open | $647,200 | ||
| Closed | $326,500 | ||
| Closed | $280,000 | ||
| Closed | $287,000 | ||
| Closed | $25,000 |
Tax History
We collect this data history from publicly available records. To have your information removed, we recommend requesting removal directly through your county’s website.
| Year | Tax Paid | Tax Assessment Tax Assessment Total Assessment is a certain percentage of the fair market value that is determined by local assessors to be the total taxable value of land and additions on the property. | Land | Improvement |
|---|---|---|---|---|
| 2025 | $10,907 | $600,600 | $179,500 | $421,100 |
| 2024 | $10,571 | $600,600 | $179,500 | $421,100 |
| 2023 | $10,186 | $600,600 | $179,500 | $421,100 |
| 2022 | $9,640 | $600,600 | $179,500 | $421,100 |
| 2021 | $9,598 | $600,600 | $179,500 | $421,100 |
| 2020 | $8,773 | $398,400 | $128,200 | $270,200 |
| 2019 | $8,757 | $398,400 | $128,200 | $270,200 |
| 2018 | $8,609 | $398,400 | $128,200 | $270,200 |
| 2017 | $8,303 | $398,400 | $128,200 | $270,200 |
| 2016 | $8,139 | $398,400 | $128,200 | $270,200 |
| 2015 | $7,797 | $364,500 | $127,200 | $237,300 |
| 2014 | $7,578 | $364,500 | $127,200 | $237,300 |
| 2013 | $7,458 | $364,500 | $127,200 | $237,300 |
Map
- 97 Old Rockingham Rd
- 30 Harris Rd
- 29 Harris Rd
- 181 Bluff St
- 8 Hazelwood Dr
- 95 Lake Shore Rd
- 29 London Rd
- 4 Alma Ave
- 3 Trina Rd
- 5 Allen Rd
- 17 Rolling Ridge Rd
- 21 Goodridge Ave
- 12 Henry St
- 34 N Policy St Unit 34
- 3 Hummingbird Ln
- 26 Veronica Ave
- 26 Sullivan Ct
- 00 Bluff St Unit 7014
- 18 Harvest Rd
- 6 Chadwick Cir
Ask me questions while you tour the home.