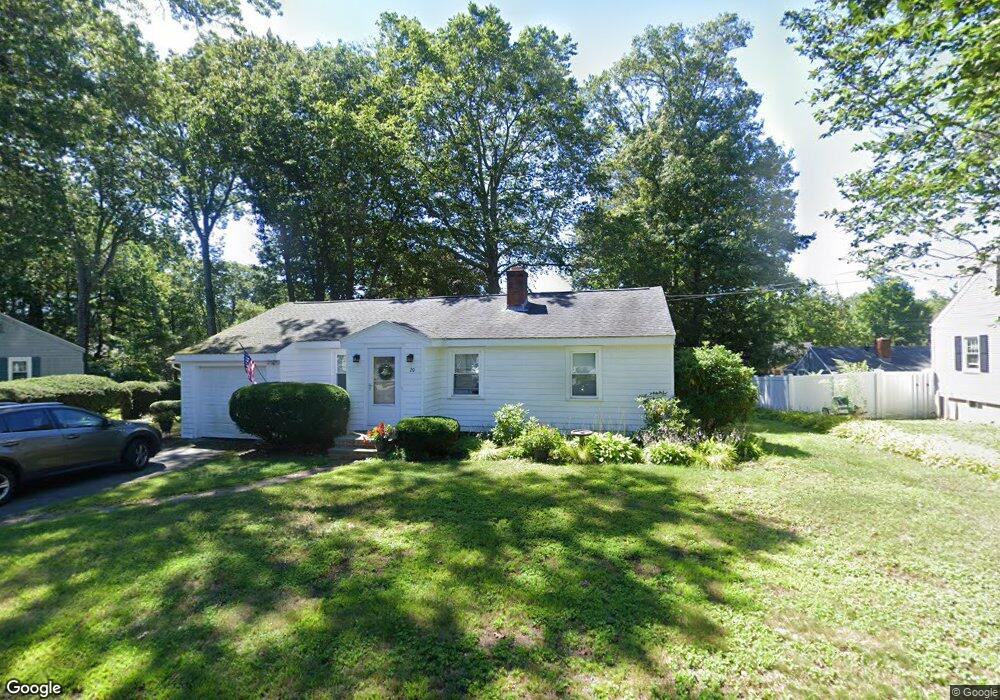
29 Moynihan Rd South Hamilton, MA 01982
Estimated Value: $647,000 - $790,000
2
Beds
1
Bath
1,014
Sq Ft
$687/Sq Ft
Est. Value
About This Home
This home is located at 29 Moynihan Rd, South Hamilton, MA 01982 and is currently estimated at $696,813, approximately $687 per square foot. 29 Moynihan Rd is a home located in Essex County with nearby schools including Winthrop School, Bessie Buker Elementary School, and Cutler Elementary School.
Ownership History
Date
Name
Owned For
Owner Type
Purchase Details
Closed on
Jun 3, 2004
Sold by
Smith David L and Smith Elizabeth A
Bought by
Smith Dorothy J
Current Estimated Value
Purchase Details
Closed on
Oct 31, 2001
Sold by
Sol Windsor Tr
Bought by
Smith David L and Smith Elizabeth A
Purchase Details
Closed on
Apr 27, 1988
Sold by
Chiary Francis E
Bought by
Windsor Sol
Create a Home Valuation Report for This Property
The Home Valuation Report is an in-depth analysis detailing your home's value as well as a comparison with similar homes in the area
Home Values in the Area
Average Home Value in this Area
Purchase History
| Date | Buyer | Sale Price | Title Company |
|---|---|---|---|
| Smith Dorothy J | $309,000 | -- | |
| Smith David L | $300,000 | -- | |
| Windsor Sol | $183,000 | -- |
Source: Public Records
Mortgage History
| Date | Status | Borrower | Loan Amount |
|---|---|---|---|
| Open | Windsor Sol | $279,300 | |
| Closed | Windsor Sol | $25,000 | |
| Closed | Windsor Sol | $315,000 |
Source: Public Records
Tax History Compared to Growth
Tax History
| Year | Tax Paid | Tax Assessment Tax Assessment Total Assessment is a certain percentage of the fair market value that is determined by local assessors to be the total taxable value of land and additions on the property. | Land | Improvement |
|---|---|---|---|---|
| 2025 | $8,423 | $538,200 | $265,900 | $272,300 |
| 2024 | $8,055 | $533,100 | $265,900 | $267,200 |
| 2023 | $7,624 | $466,600 | $251,600 | $215,000 |
| 2022 | $7,608 | $425,500 | $227,000 | $198,500 |
| 2021 | $7,053 | $402,800 | $227,000 | $175,800 |
| 2020 | $6,502 | $382,900 | $227,000 | $155,900 |
| 2019 | $6,162 | $373,900 | $220,300 | $153,600 |
| 2018 | $5,666 | $349,300 | $208,000 | $141,300 |
| 2017 | $5,504 | $327,400 | $194,400 | $133,000 |
| 2016 | $5,322 | $308,500 | $178,300 | $130,200 |
| 2015 | $5,043 | $295,100 | $169,800 | $125,300 |
| 2014 | $5,029 | $289,000 | $173,600 | $115,400 |
Source: Public Records
Map
Nearby Homes