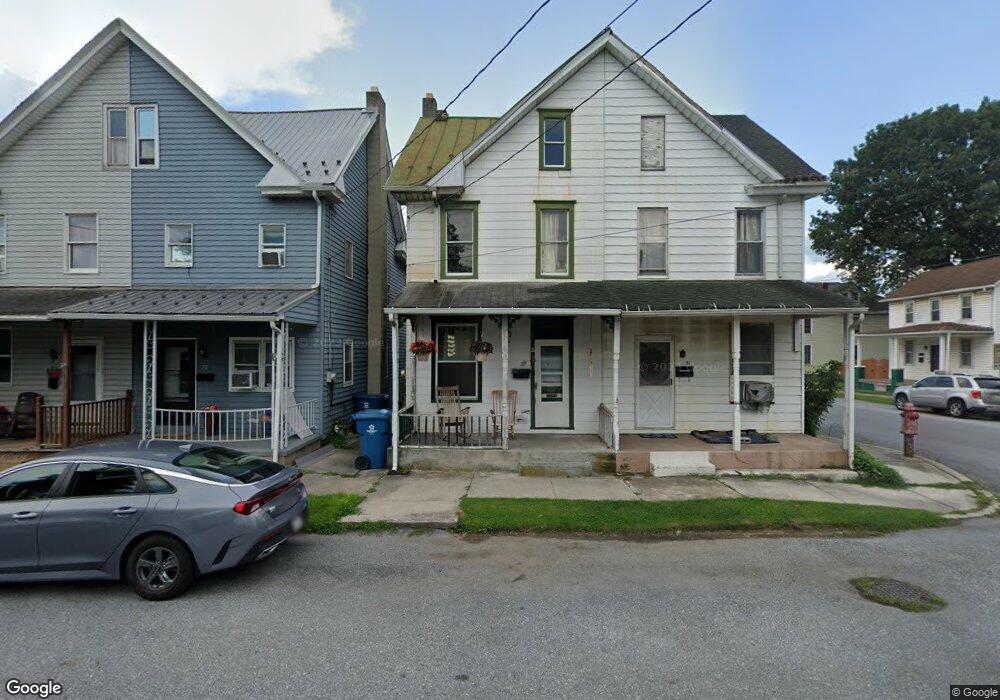
29 Mumma St Highspire, PA 17034
Estimated Value: $134,982 - $160,000
3
Beds
1
Bath
1,350
Sq Ft
$110/Sq Ft
Est. Value
About This Home
This home is located at 29 Mumma St, Highspire, PA 17034 and is currently estimated at $147,996, approximately $109 per square foot. 29 Mumma St is a home located in Dauphin County with nearby schools including Steelton-Highspire El School, Steelton-Highspire High School, and The Samuel School.
Ownership History
Date
Name
Owned For
Owner Type
Purchase Details
Closed on
Jan 26, 2015
Sold by
Furjanic Amanda
Bought by
Furjanic Amanda J
Current Estimated Value
Home Financials for this Owner
Home Financials are based on the most recent Mortgage that was taken out on this home.
Original Mortgage
$56,750
Outstanding Balance
$43,594
Interest Rate
3.84%
Mortgage Type
New Conventional
Estimated Equity
$104,402
Purchase Details
Closed on
Feb 26, 2007
Sold by
Nationstar Mortgage Lc
Bought by
Furjanic Amanda
Home Financials for this Owner
Home Financials are based on the most recent Mortgage that was taken out on this home.
Original Mortgage
$59,000
Interest Rate
6.27%
Mortgage Type
New Conventional
Create a Home Valuation Report for This Property
The Home Valuation Report is an in-depth analysis detailing your home's value as well as a comparison with similar homes in the area
Home Values in the Area
Average Home Value in this Area
Purchase History
| Date | Buyer | Sale Price | Title Company |
|---|---|---|---|
| Furjanic Amanda J | -- | -- | |
| Furjanic Amanda | $59,000 | -- |
Source: Public Records
Mortgage History
| Date | Status | Borrower | Loan Amount |
|---|---|---|---|
| Open | Furjanic Amanda J | $56,750 | |
| Previous Owner | Furjanic Amanda | $59,000 |
Source: Public Records
Tax History Compared to Growth
Tax History
| Year | Tax Paid | Tax Assessment Tax Assessment Total Assessment is a certain percentage of the fair market value that is determined by local assessors to be the total taxable value of land and additions on the property. | Land | Improvement |
|---|---|---|---|---|
| 2025 | $1,985 | $35,000 | $6,100 | $28,900 |
| 2024 | $1,880 | $35,000 | $6,100 | $28,900 |
| 2023 | $1,880 | $35,000 | $6,100 | $28,900 |
| 2022 | $1,880 | $35,000 | $6,100 | $28,900 |
| 2021 | $1,880 | $35,000 | $6,100 | $28,900 |
| 2020 | $1,880 | $35,000 | $6,100 | $28,900 |
| 2019 | $1,862 | $35,000 | $6,100 | $28,900 |
| 2018 | $1,818 | $35,000 | $6,100 | $28,900 |
| 2017 | $1,818 | $35,000 | $6,100 | $28,900 |
| 2016 | $0 | $35,000 | $6,100 | $28,900 |
| 2015 | -- | $35,000 | $6,100 | $28,900 |
| 2014 | -- | $35,000 | $6,100 | $28,900 |
Source: Public Records
Map
Nearby Homes