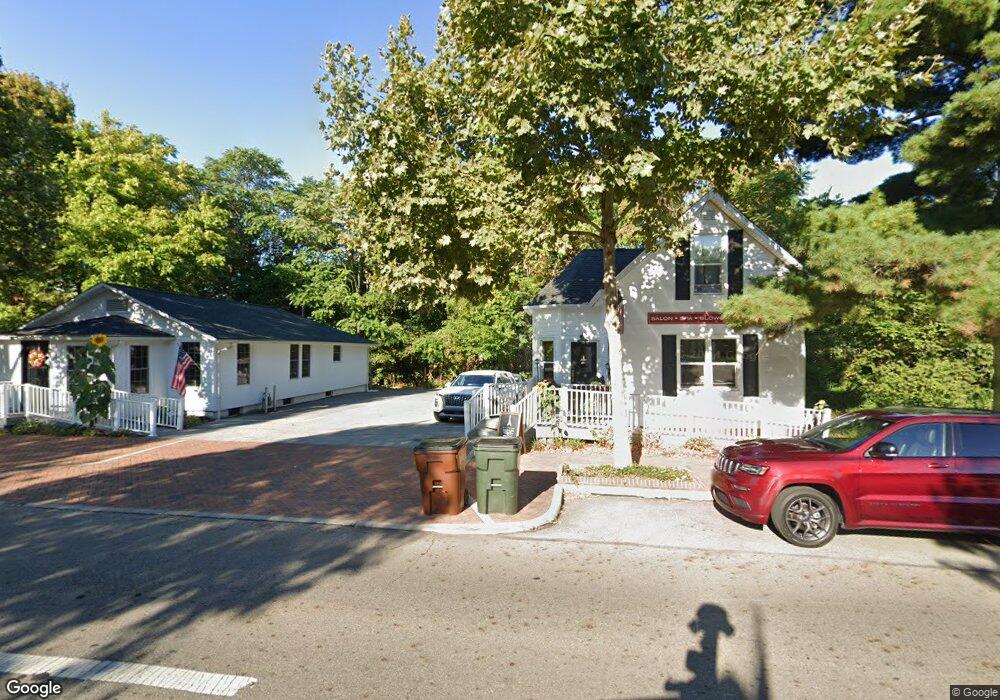
29 N High St New Albany, OH 43054
--
Bed
--
Bath
4,050
Sq Ft
0.76
Acres
About This Home
This home is located at 29 N High St, New Albany, OH 43054. 29 N High St is a home located in Franklin County with nearby schools including New Albany Primary School, New Albany Intermediate School, and New Albany Middle School.
Ownership History
Date
Name
Owned For
Owner Type
Purchase Details
Closed on
Sep 25, 2015
Sold by
B & D Properties Of New Albany Llc
Bought by
The New Albany Company Llc
Purchase Details
Closed on
Dec 2, 2004
Sold by
Levy Robert A and Smucker Daniel L
Bought by
B & D Properties Of New Albany Llc
Home Financials for this Owner
Home Financials are based on the most recent Mortgage that was taken out on this home.
Original Mortgage
$1,100,000
Interest Rate
5.82%
Mortgage Type
Commercial
Purchase Details
Closed on
Nov 16, 2004
Sold by
Eyestone David R
Bought by
Levy Robert A and Smucker Daniel L
Home Financials for this Owner
Home Financials are based on the most recent Mortgage that was taken out on this home.
Original Mortgage
$1,100,000
Interest Rate
5.82%
Mortgage Type
Commercial
Purchase Details
Closed on
May 26, 1999
Sold by
Flanagan Anita K and Flanagan Thomas F
Bought by
Eyestone David R and Eyestone Cynthia L
Purchase Details
Closed on
Jul 14, 1998
Sold by
Flanagan Thomas F and Flanagan Anita K
Bought by
Eyestone David R and Eyestone Cynthia L
Home Financials for this Owner
Home Financials are based on the most recent Mortgage that was taken out on this home.
Original Mortgage
$364,000
Interest Rate
7.5%
Mortgage Type
Land Contract Argmt. Of Sale
Purchase Details
Closed on
Apr 26, 1978
Bought by
Flanagan Thomas F
Create a Home Valuation Report for This Property
The Home Valuation Report is an in-depth analysis detailing your home's value as well as a comparison with similar homes in the area
Home Values in the Area
Average Home Value in this Area
Purchase History
| Date | Buyer | Sale Price | Title Company |
|---|---|---|---|
| The New Albany Company Llc | $900,000 | Stewart Title | |
| B & D Properties Of New Albany Llc | -- | New Century | |
| Levy Robert A | $1,210,000 | New Century | |
| Eyestone David R | $478,000 | Connor Title Co | |
| Eyestone David R | $450,000 | -- | |
| Flanagan Thomas F | $42,000 | -- |
Source: Public Records
Mortgage History
| Date | Status | Borrower | Loan Amount |
|---|---|---|---|
| Previous Owner | B & D Properties Of New Albany Llc | $1,100,000 | |
| Previous Owner | Eyestone David R | $364,000 |
Source: Public Records
Tax History Compared to Growth
Tax History
| Year | Tax Paid | Tax Assessment Tax Assessment Total Assessment is a certain percentage of the fair market value that is determined by local assessors to be the total taxable value of land and additions on the property. | Land | Improvement |
|---|---|---|---|---|
| 2024 | $39,740 | $471,600 | $68,460 | $403,140 |
| 2023 | $37,801 | $471,600 | $68,460 | $403,140 |
| 2022 | $28,225 | $304,750 | $44,590 | $260,160 |
| 2021 | $27,271 | $304,750 | $44,590 | $260,160 |
| 2020 | $26,923 | $304,750 | $44,590 | $260,160 |
| 2019 | $22,382 | $237,240 | $37,170 | $200,070 |
| 2018 | $30,455 | $237,240 | $37,170 | $200,070 |
| 2017 | $21,693 | $237,240 | $37,170 | $200,070 |
| 2016 | $39,499 | $418,820 | $37,170 | $381,650 |
| 2015 | $39,573 | $418,820 | $37,170 | $381,650 |
| 2014 | $39,221 | $418,820 | $37,170 | $381,650 |
| 2013 | $1,916 | $40,845 | $4,900 | $35,945 |
Source: Public Records
Map
Nearby Homes
- 8127 Griswold Dr
- 8175 Parsons Pass
- 5074 Hearthstone Park Dr
- 105 Keswick Dr
- 115 Keswick Dr
- 5950 Johnstown Rd
- 6869 Cedar Brook Place
- 5945 Johnstown Rd
- 4945 Yantis Dr
- 6500 Cedar Glen Ct
- 5510 Steele Ct
- 8309 Marwithe Place
- 25 Pickett Place
- 7200 Fernridge Dr
- 10087 Johnstown Rd
- 5445 Welbourne Place Unit 25
- 5650 Harlem Rd
- 5685 Jersey Dr
- 6964 Aster Dr
- 7485 Central College Rd