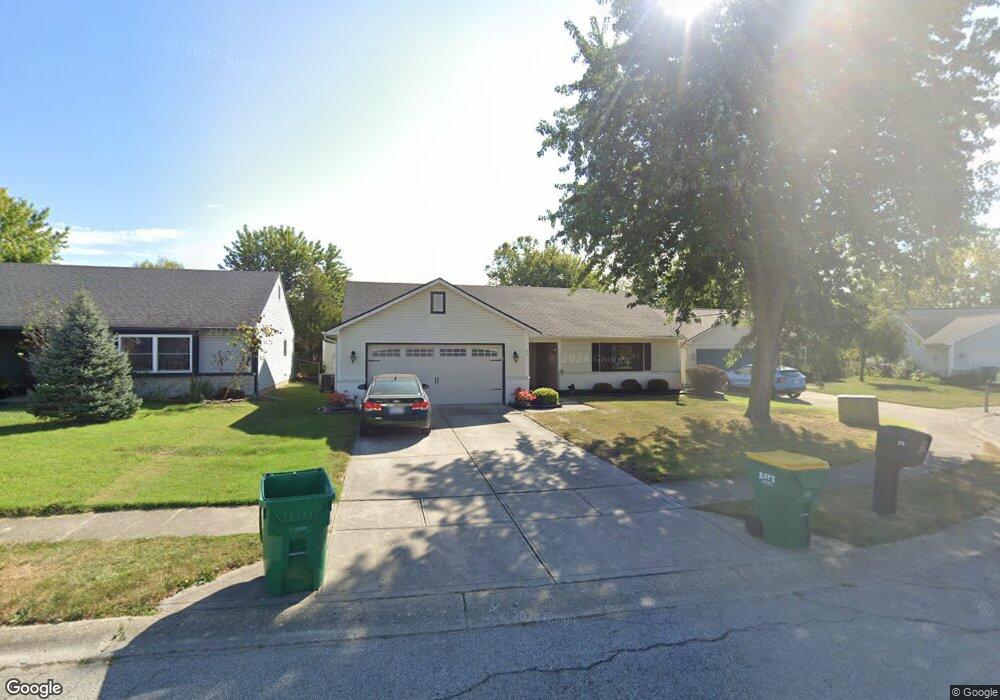
29 Nash Ct Brownsburg, IN 46112
Estimated Value: $259,000 - $277,000
3
Beds
2
Baths
1,400
Sq Ft
$190/Sq Ft
Est. Value
About This Home
This home is located at 29 Nash Ct, Brownsburg, IN 46112 and is currently estimated at $265,634, approximately $189 per square foot. 29 Nash Ct is a home located in Hendricks County with nearby schools including Eagle Elementary School, Brownsburg West Middle School, and Brownsburg High School.
Ownership History
Date
Name
Owned For
Owner Type
Purchase Details
Closed on
Jun 3, 2005
Sold by
Lebeter Brian J and Conley Lebeter Jamie L
Bought by
Neeb Brice
Current Estimated Value
Home Financials for this Owner
Home Financials are based on the most recent Mortgage that was taken out on this home.
Original Mortgage
$91,200
Outstanding Balance
$48,756
Interest Rate
6.65%
Mortgage Type
Adjustable Rate Mortgage/ARM
Estimated Equity
$216,878
Create a Home Valuation Report for This Property
The Home Valuation Report is an in-depth analysis detailing your home's value as well as a comparison with similar homes in the area
Home Values in the Area
Average Home Value in this Area
Purchase History
| Date | Buyer | Sale Price | Title Company |
|---|---|---|---|
| Neeb Brice | -- | None Available |
Source: Public Records
Mortgage History
| Date | Status | Borrower | Loan Amount |
|---|---|---|---|
| Open | Neeb Brice | $91,200 |
Source: Public Records
Tax History
| Year | Tax Paid | Tax Assessment Tax Assessment Total Assessment is a certain percentage of the fair market value that is determined by local assessors to be the total taxable value of land and additions on the property. | Land | Improvement |
|---|---|---|---|---|
| 2025 | $2,033 | $212,700 | $34,600 | $178,100 |
| 2024 | $2,033 | $203,300 | $34,600 | $168,700 |
| 2023 | $1,900 | $188,600 | $31,200 | $157,400 |
| 2022 | $1,792 | $180,000 | $29,700 | $150,300 |
| 2021 | $1,686 | $166,800 | $29,700 | $137,100 |
| 2020 | $1,562 | $154,400 | $29,700 | $124,700 |
| 2019 | $1,446 | $145,300 | $27,900 | $117,400 |
| 2018 | $1,372 | $136,000 | $27,900 | $108,100 |
| 2017 | $1,252 | $123,900 | $25,300 | $98,600 |
| 2016 | $1,182 | $118,800 | $25,300 | $93,500 |
| 2014 | $1,107 | $112,500 | $24,400 | $88,100 |
Source: Public Records
Map
Nearby Homes
- 4475 Yellowwood Ave
- 4507 Yellowwood Ave
- 4472 Yellowwood Ave
- 4494 Yellowwood Ave
- 6280 Chelsea St
- 4498 Yellowwood Ave
- 4502 Yellowwood Ave
- 4481 Yellowwood Ave
- 4508 Yellowwood Ave
- 6278 Chelsea St
- 7643 Sagamore Dr
- 6 Kristelli Ct
- 1134 Willow Springs Blvd
- 1432 Hideaway Cir
- 390 Vinewood Dr N
- 212 Hamilton St
- 122 Prairie Pkwy
- 506 S Green St
- 1908 Odell St
- 1418 Hornaday Rd
Your Personal Tour Guide
Ask me questions while you tour the home.