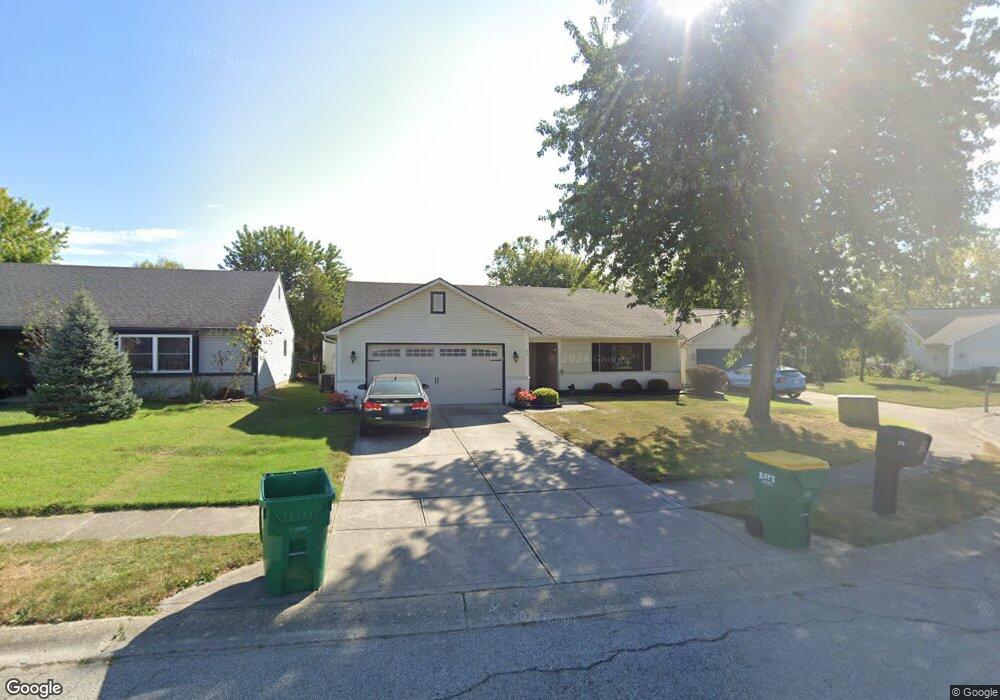
29 Nash Ct Brownsburg, IN 46112
Brownsburg AreaEstimated Value: $269,087 - $279,000
About This Home
This home is located at 29 Nash Ct, Brownsburg, IN 46112 and is currently estimated at $272,772, approximately $194 per square foot. 29 Nash Ct is a home located in Hendricks County with nearby schools including Eagle Elementary School, Brownsburg West Middle School, and Brownsburg High School.
Ownership History
We collect this data history from publicly available records. To have your information removed, we recommend requesting removal directly through your county’s website.
Purchase Details
Home Financials for this Owner
Home Financials are based on the most recent Mortgage that was taken out on this home.Home Values in the Area
Average Home Value in this Area
Purchase History
We collect this data history from publicly available records. To have your information removed, we recommend requesting removal directly through your county’s website.
| Date | Buyer | Sale Price | Title Company |
|---|---|---|---|
| -- | None Available |
Mortgage History
We collect this data history from publicly available records. To have your information removed, we recommend requesting removal directly through your county’s website.
| Date | Status | Borrower | Loan Amount |
|---|---|---|---|
| Open | $100,000 | ||
| Closed | $122,700 | ||
| Closed | $115,710 | ||
| Closed | $91,200 |
Tax History
We collect this data history from publicly available records. To have your information removed, we recommend requesting removal directly through your county’s website.
| Year | Tax Paid | Tax Assessment Tax Assessment Total Assessment is a certain percentage of the fair market value that is determined by local assessors to be the total taxable value of land and additions on the property. | Land | Improvement |
|---|---|---|---|---|
| 2025 | $4,254 | $212,700 | $34,600 | $178,100 |
| 2024 | $2,033 | $203,300 | $34,600 | $168,700 |
| 2023 | $1,900 | $188,600 | $31,200 | $157,400 |
| 2022 | $1,792 | $180,000 | $29,700 | $150,300 |
| 2021 | $1,686 | $166,800 | $29,700 | $137,100 |
| 2020 | $1,562 | $154,400 | $29,700 | $124,700 |
| 2019 | $1,446 | $145,300 | $27,900 | $117,400 |
| 2018 | $1,372 | $136,000 | $27,900 | $108,100 |
| 2017 | $1,252 | $123,900 | $25,300 | $98,600 |
| 2016 | $1,182 | $118,800 | $25,300 | $93,500 |
| 2014 | $1,107 | $112,500 | $24,400 | $88,100 |
Map
- 6280 Chelsea St
- 1278 Holiday Ln W
- 1339 Holiday Ln E
- 4539 Tolleston Ave
- 139 Sycamore St Unit 143
- 1220 Willow Springs Blvd Unit 38
- 1455 Sweet Gum Dr S
- 1118 Willow Springs Blvd
- 1112 Randall Way
- 1418 Hideaway Cir
- 811 S School St
- 1470 Hideaway Cir
- 390 Vinewood Dr N
- 1466 Hideaway Cir
- 640 S School St Unit 28
- 1502 Hideaway Dr
- 153 Foxwood Dr
- 614 S Grant St
- 1344 Brownswood Dr
- 45 Trotters Run
Ask me questions while you tour the home.