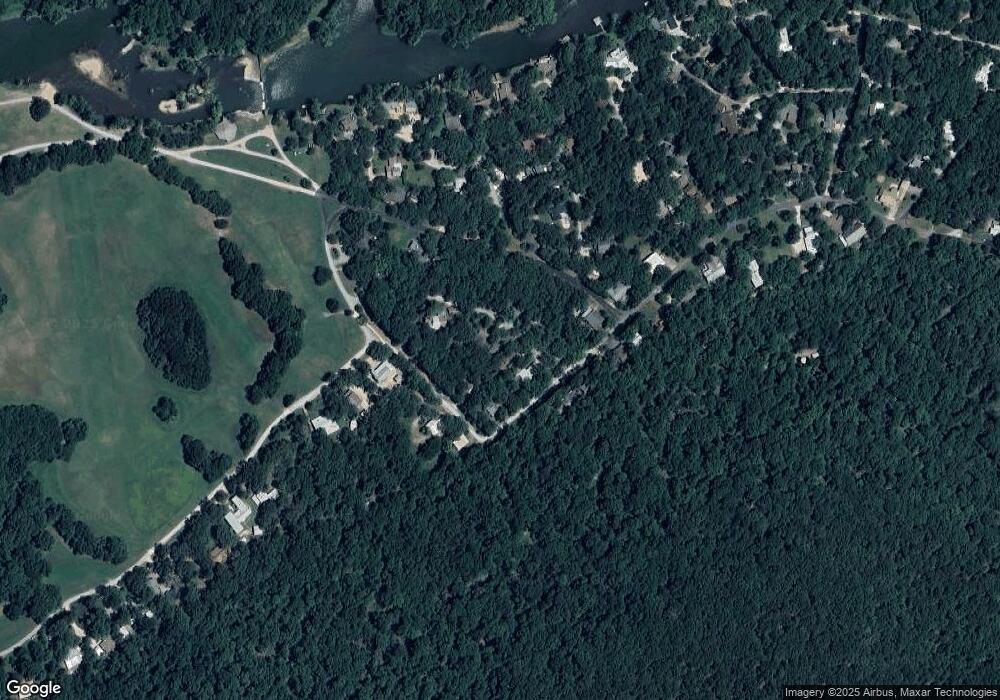
29 Oak St Locust Grove, OK 74352
Estimated Value: $312,000 - $419,000
2
Beds
1
Bath
1,176
Sq Ft
$315/Sq Ft
Est. Value
About This Home
This home is located at 29 Oak St, Locust Grove, OK 74352 and is currently estimated at $370,735, approximately $315 per square foot. 29 Oak St is a home with nearby schools including Locust Grove Early Lrning Center, Locust Grove Upper Elementary School, and Locust Grove Middle School.
Ownership History
Date
Name
Owned For
Owner Type
Purchase Details
Closed on
Sep 1, 2020
Sold by
The Kathy L Oden Hall Trust
Bought by
Webb Jean S
Current Estimated Value
Home Financials for this Owner
Home Financials are based on the most recent Mortgage that was taken out on this home.
Original Mortgage
$220,500
Outstanding Balance
$195,234
Interest Rate
2.9%
Mortgage Type
New Conventional
Estimated Equity
$175,501
Purchase Details
Closed on
Apr 12, 2019
Sold by
Stephens James P
Bought by
Oden Hall Kathryn L
Purchase Details
Closed on
Mar 11, 2002
Sold by
Mckinney Carson and Mckinney Janice
Bought by
Stephens James P
Purchase Details
Closed on
Apr 12, 2000
Sold by
Clark Diana
Bought by
Mckinney Carson and Mckinney Janice
Purchase Details
Closed on
Mar 2, 1998
Sold by
Montgomery Charles
Bought by
Clark Diana
Purchase Details
Closed on
Nov 1, 1991
Sold by
Ramano James
Bought by
Montgomery Charles
Create a Home Valuation Report for This Property
The Home Valuation Report is an in-depth analysis detailing your home's value as well as a comparison with similar homes in the area
Home Values in the Area
Average Home Value in this Area
Purchase History
| Date | Buyer | Sale Price | Title Company |
|---|---|---|---|
| Webb Jean S | $245,000 | Old Republic Natl Ttl Ins Co | |
| Oden Hall Kathryn L | $187,500 | Mayes County Abstract Co | |
| Stephens James P | $92,000 | -- | |
| Mckinney Carson | $187,000 | -- | |
| Clark Diana | $61,000 | -- | |
| Montgomery Charles | $37,000 | -- |
Source: Public Records
Mortgage History
| Date | Status | Borrower | Loan Amount |
|---|---|---|---|
| Open | Webb Jean S | $220,500 |
Source: Public Records
Tax History Compared to Growth
Tax History
| Year | Tax Paid | Tax Assessment Tax Assessment Total Assessment is a certain percentage of the fair market value that is determined by local assessors to be the total taxable value of land and additions on the property. | Land | Improvement |
|---|---|---|---|---|
| 2025 | $2,953 | $33,336 | $17,865 | $15,471 |
| 2024 | $2,953 | $31,748 | $17,014 | $14,734 |
| 2023 | $2,953 | $30,237 | $16,545 | $13,692 |
| 2022 | $2,598 | $28,797 | $16,016 | $12,781 |
| 2021 | $2,527 | $27,426 | $16,016 | $11,410 |
| 2020 | $1,971 | $21,071 | $12,012 | $9,059 |
| 2019 | $1,637 | $17,486 | $8,841 | $8,645 |
| 2018 | $1,590 | $16,654 | $5,764 | $10,890 |
| 2017 | $1,516 | $15,861 | $5,489 | $10,372 |
| 2016 | $1,409 | $15,106 | $5,228 | $9,878 |
| 2015 | $1,385 | $14,386 | $4,979 | $9,407 |
| 2014 | $1,320 | $13,702 | $4,742 | $8,960 |
Source: Public Records
Map
Nearby Homes