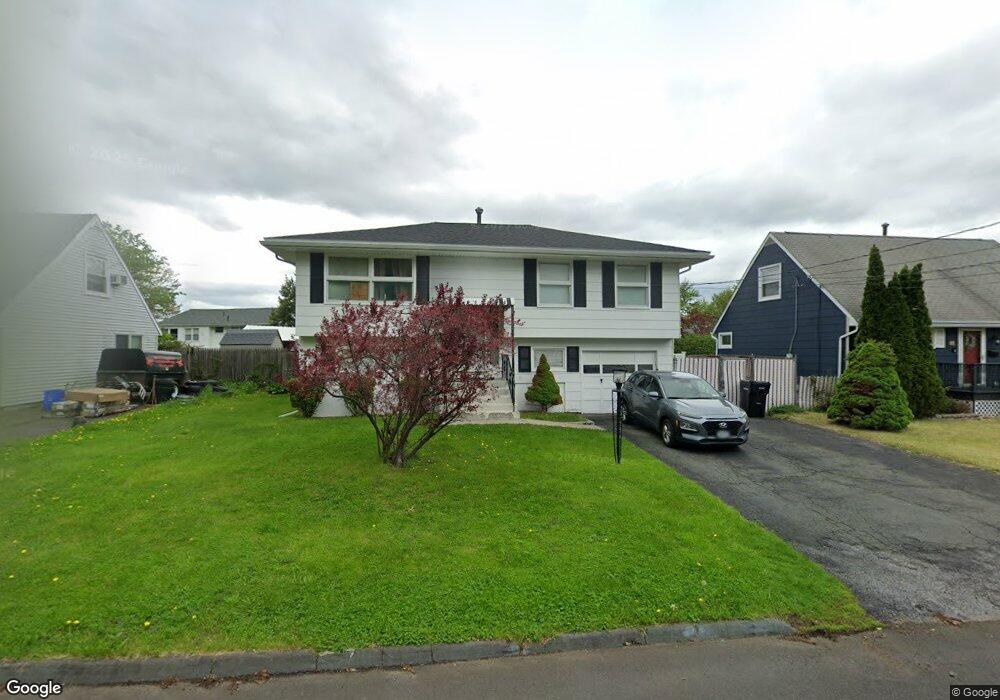
29 Oneil St Troy, NY 12180
South Troy NeighborhoodEstimated Value: $257,000 - $283,000
3
Beds
2
Baths
1,625
Sq Ft
$167/Sq Ft
Est. Value
About This Home
This home is located at 29 Oneil St, Troy, NY 12180 and is currently estimated at $270,574, approximately $166 per square foot. 29 Oneil St is a home located in Rensselaer County with nearby schools including Carroll Hill School, Troy Middle School, and Troy High School.
Ownership History
Date
Name
Owned For
Owner Type
Purchase Details
Closed on
Mar 10, 2006
Sold by
Novak Michael D
Bought by
Rubio Nelly
Current Estimated Value
Home Financials for this Owner
Home Financials are based on the most recent Mortgage that was taken out on this home.
Original Mortgage
$30,850
Outstanding Balance
$7,303
Interest Rate
6.27%
Mortgage Type
Unknown
Estimated Equity
$263,271
Purchase Details
Closed on
Apr 29, 1997
Sold by
Rossi Sal and Rossi Maria
Bought by
Novak Carrie A and Novak Michael D
Create a Home Valuation Report for This Property
The Home Valuation Report is an in-depth analysis detailing your home's value as well as a comparison with similar homes in the area
Home Values in the Area
Average Home Value in this Area
Purchase History
| Date | Buyer | Sale Price | Title Company |
|---|---|---|---|
| Rubio Nelly | $154,250 | -- | |
| Novak Carrie A | $95,000 | -- |
Source: Public Records
Mortgage History
| Date | Status | Borrower | Loan Amount |
|---|---|---|---|
| Open | Rubio Nelly | $30,850 | |
| Open | Rubio Nelly | $123,400 |
Source: Public Records
Tax History
| Year | Tax Paid | Tax Assessment Tax Assessment Total Assessment is a certain percentage of the fair market value that is determined by local assessors to be the total taxable value of land and additions on the property. | Land | Improvement |
|---|---|---|---|---|
| 2024 | $6,163 | $142,000 | $14,000 | $128,000 |
| 2023 | $6,083 | $142,000 | $14,000 | $128,000 |
| 2022 | $6,233 | $142,000 | $14,000 | $128,000 |
| 2021 | $2,025 | $142,000 | $14,000 | $128,000 |
| 2020 | $2,635 | $142,000 | $14,000 | $128,000 |
| 2019 | $4,238 | $142,000 | $14,000 | $128,000 |
| 2018 | $4,238 | $142,000 | $14,000 | $128,000 |
| 2017 | $4,000 | $142,000 | $14,000 | $128,000 |
| 2016 | $5,701 | $142,000 | $14,000 | $128,000 |
| 2015 | -- | $142,000 | $14,000 | $128,000 |
| 2014 | -- | $142,000 | $14,000 | $128,000 |
Source: Public Records
Map
Nearby Homes
Your Personal Tour Guide
Ask me questions while you tour the home.