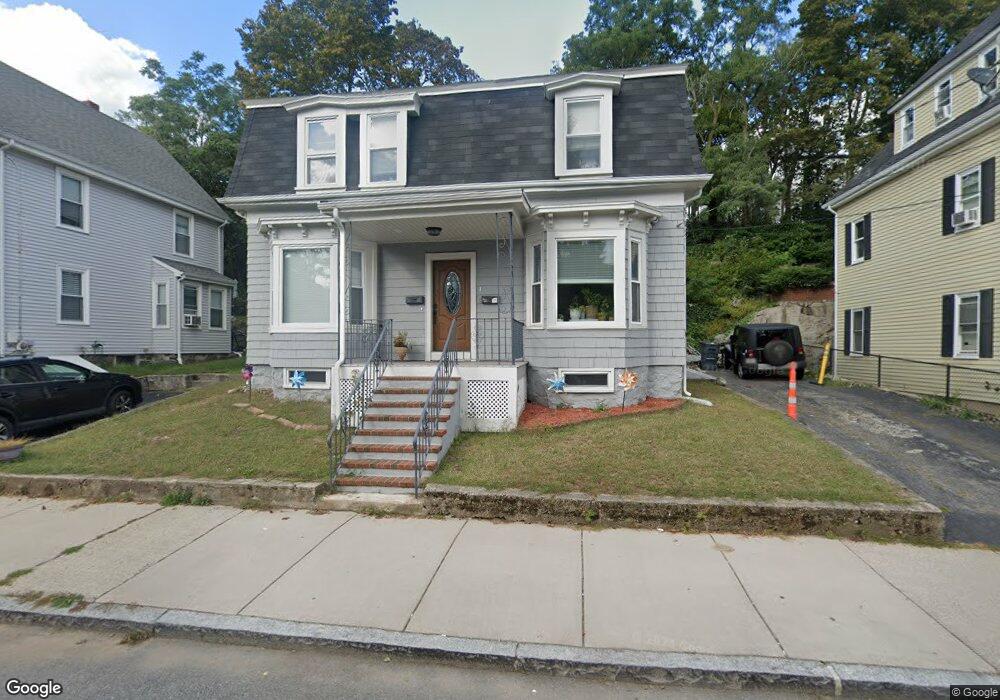
29 Orchard St Malden, MA 02148
Maplewood NeighborhoodEstimated Value: $891,012 - $1,299,000
5
Beds
2
Baths
2,035
Sq Ft
$511/Sq Ft
Est. Value
About This Home
This home is located at 29 Orchard St, Malden, MA 02148 and is currently estimated at $1,040,753, approximately $511 per square foot. 29 Orchard St is a home located in Middlesex County with nearby schools including Malden High School, Cheverus Catholic School, and Malden Catholic.
Ownership History
Date
Name
Owned For
Owner Type
Purchase Details
Closed on
Sep 3, 1996
Sold by
Pazyra Charles G
Bought by
Fula Annmarie
Current Estimated Value
Home Financials for this Owner
Home Financials are based on the most recent Mortgage that was taken out on this home.
Original Mortgage
$126,800
Interest Rate
8.18%
Mortgage Type
Purchase Money Mortgage
Create a Home Valuation Report for This Property
The Home Valuation Report is an in-depth analysis detailing your home's value as well as a comparison with similar homes in the area
Home Values in the Area
Average Home Value in this Area
Purchase History
| Date | Buyer | Sale Price | Title Company |
|---|---|---|---|
| Fula Annmarie | $123,000 | -- | |
| Fula Annmarie | $123,000 | -- |
Source: Public Records
Mortgage History
| Date | Status | Borrower | Loan Amount |
|---|---|---|---|
| Open | Fula Annmarie | $128,500 | |
| Closed | Fula Annmarie | $126,800 | |
| Previous Owner | Fula Annmarie | $30,000 | |
| Previous Owner | Fula Annmarie | $27,000 |
Source: Public Records
Tax History Compared to Growth
Tax History
| Year | Tax Paid | Tax Assessment Tax Assessment Total Assessment is a certain percentage of the fair market value that is determined by local assessors to be the total taxable value of land and additions on the property. | Land | Improvement |
|---|---|---|---|---|
| 2025 | $85 | $754,500 | $327,000 | $427,500 |
| 2024 | $8,323 | $712,000 | $309,300 | $402,700 |
| 2023 | $7,854 | $644,300 | $282,800 | $361,500 |
| 2022 | $7,483 | $605,900 | $256,300 | $349,600 |
| 2021 | $7,825 | $636,700 | $234,200 | $402,500 |
| 2020 | $7,548 | $596,700 | $222,700 | $374,000 |
| 2019 | $7,395 | $557,300 | $212,100 | $345,200 |
| 2018 | $7,111 | $504,700 | $179,000 | $325,700 |
| 2017 | $6,819 | $481,200 | $179,000 | $302,200 |
| 2016 | $5,555 | $366,400 | $170,100 | $196,300 |
| 2015 | $5,370 | $341,400 | $160,400 | $181,000 |
| 2014 | $5,043 | $313,200 | $145,800 | $167,400 |
Source: Public Records
Map
Nearby Homes
- 26 Webber St Unit 1
- 7 Valley St
- 15 Mount Washington Ave
- 590-592 Salem St
- 117-119 Rockwell St
- 14 Dodge St
- 18 Dodge St
- 170 Columbia St
- 46 Pagum St
- 7 Sawyer Ct
- 15 Milton St
- 494 Salem St
- 11 Granville Place
- 47 Neal St
- 101 Waite St Unit B5
- 452 Salem St
- 68 Princeton Rd
- 26 Lanark Rd
- 156 Bainbridge St
- 153 Cherry St
- 29 Orchard St Unit 1
- 25 Orchard St
- 25 Orchard St Unit 2
- 25 Orchard St Unit 1
- 33 Orchard St
- 37 Orchard St
- 21 Orchard St
- 28 Orchard St
- 28 Orchard St Unit 1
- 28 Orchard St Unit 2
- 32 Orchard St
- 36 Orchard St
- 5 Lebanon Terrace Unit B
- 5 Lebanon Terrace Unit A
- 5 Lebanon Terrace
- 5 Lebanon Terrace Unit 2
- 5 Lebanon Terrace
- 5 Lebanon Terrace Unit 3
- 5 Lebanon Terrace Unit 2
- 5B Lebanon Terrace Unit 3