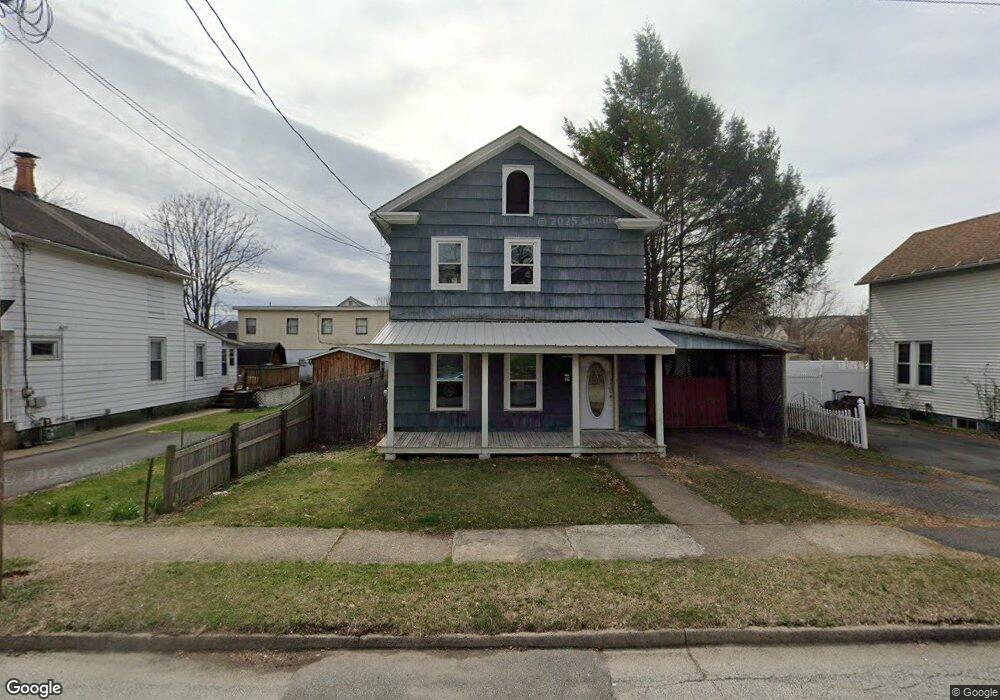
29 Orchard St Port Jervis, NY 12771
Estimated Value: $173,000 - $271,000
3
Beds
1
Bath
1,432
Sq Ft
$154/Sq Ft
Est. Value
About This Home
This home is located at 29 Orchard St, Port Jervis, NY 12771 and is currently estimated at $220,064, approximately $153 per square foot. 29 Orchard St is a home located in Orange County with nearby schools including Port Jervis High School and New Life Christian Day School.
Ownership History
Date
Name
Owned For
Owner Type
Purchase Details
Closed on
Feb 18, 2011
Sold by
Sec Of Hud
Bought by
Liang Yufeng
Current Estimated Value
Purchase Details
Closed on
Sep 30, 2010
Sold by
Ronald E Helhoski As Referee
Bought by
Secretary Of Hud
Purchase Details
Closed on
Feb 14, 2001
Sold by
Thompson Richard C and Thompson Ada
Bought by
Edwards Scott
Home Financials for this Owner
Home Financials are based on the most recent Mortgage that was taken out on this home.
Original Mortgage
$57,800
Interest Rate
6.89%
Mortgage Type
FHA
Create a Home Valuation Report for This Property
The Home Valuation Report is an in-depth analysis detailing your home's value as well as a comparison with similar homes in the area
Home Values in the Area
Average Home Value in this Area
Purchase History
| Date | Buyer | Sale Price | Title Company |
|---|---|---|---|
| Liang Yufeng | $20,200 | David Hannigan | |
| Secretary Of Hud | $102,232 | Steven J Baum | |
| Edwards Scott | $58,300 | -- |
Source: Public Records
Mortgage History
| Date | Status | Borrower | Loan Amount |
|---|---|---|---|
| Previous Owner | Edwards Scott | $57,800 |
Source: Public Records
Tax History Compared to Growth
Tax History
| Year | Tax Paid | Tax Assessment Tax Assessment Total Assessment is a certain percentage of the fair market value that is determined by local assessors to be the total taxable value of land and additions on the property. | Land | Improvement |
|---|---|---|---|---|
| 2024 | $1,256 | $17,500 | $6,250 | $11,250 |
| 2023 | $1,256 | $17,500 | $6,250 | $11,250 |
| 2022 | $1,605 | $17,500 | $6,250 | $11,250 |
| 2021 | $1,985 | $25,000 | $6,250 | $18,750 |
| 2020 | $2,036 | $25,000 | $6,250 | $18,750 |
| 2019 | $248 | $25,000 | $6,250 | $18,750 |
| 2018 | $3,502 | $25,000 | $6,250 | $18,750 |
| 2017 | $1,967 | $25,000 | $6,250 | $18,750 |
| 2016 | $2,553 | $25,000 | $6,250 | $18,750 |
| 2015 | -- | $25,000 | $6,250 | $18,750 |
| 2014 | -- | $25,000 | $6,250 | $18,750 |
Source: Public Records
Map
Nearby Homes
- 39 Church St Unit 3
- 19 Barcelow St
- 33 Seward Ave
- 115 Hammond St
- 178-180 Ball St
- 141 Hammond St
- 138 Front St Unit 140
- 142 Ball St
- 14 Division St
- 131 Front St
- 120 Jersey Ave
- 92 Front St
- 701 United States Route 209
- 165 Front St
- 4 Elizabeth St
- 20 Kingston Ave
- 25 Bruce St
- 42 Sussex St
- 4 Catherine St
- 189 E Main St
- 31 Orchard St
- 27 Orchard St
- 33 Orchard St
- 40 Barcelow St Unit 42
- 42 Barcelow St
- 30 Orchard St
- 32 Orchard St
- 35 Orchard St Unit 37
- 65 Seward Ave
- 34 Orchard St
- 0 Orchard St
- 36 Orchard St
- 52 Barcelow St
- 67 Seward Ave
- 38 Orchard St
- 55 Seward Ave
- 39 Orchard St
- 41 Barcelow St
- 43 Barcelow St
- 45 Barcelow St