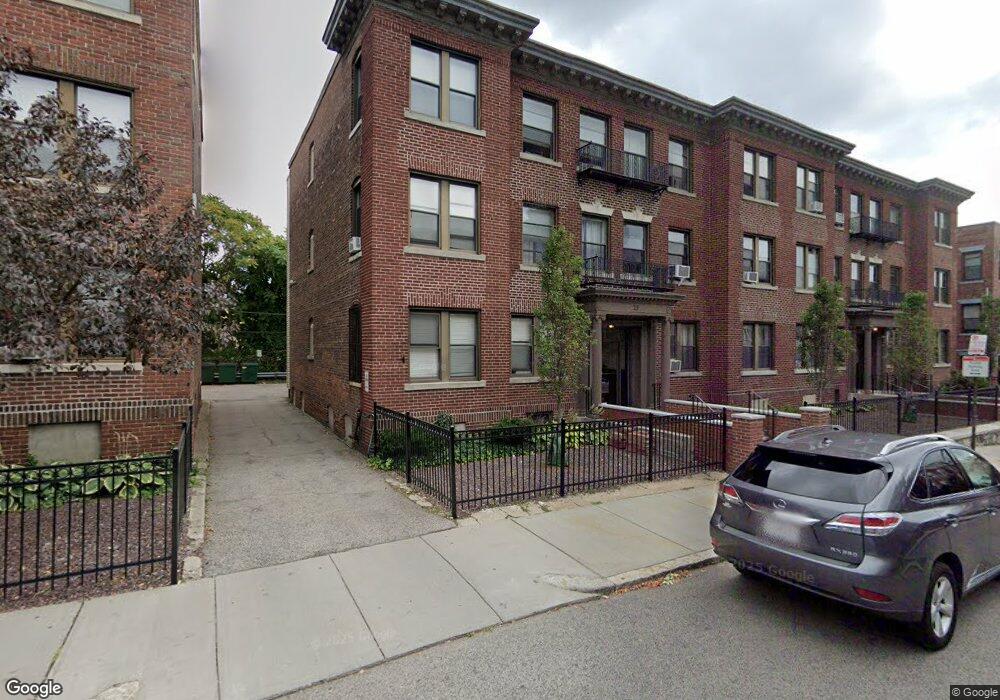
29 Park Vale Ave Unit 1 Allston, MA 02134
Commonwealth NeighborhoodEstimated Value: $581,707 - $664,000
4
Beds
2
Baths
9,999
Sq Ft
$62/Sq Ft
Est. Value
About This Home
Contact EDGE for more information on this listing, and hundreds of our other listings! See why more people are choosing the highest and most-reviewed real estate firm in Massachusetts. Brokerage fee applies. EDGE Realty Advisors is not liable for any errors, omissions, or changes to terms and conditions of this rental.
Ownership History
Date
Name
Owned For
Owner Type
Purchase Details
Closed on
Jan 16, 2008
Sold by
Deutsche Bank Natl T C
Bought by
Beaton Christine
Current Estimated Value
Home Financials for this Owner
Home Financials are based on the most recent Mortgage that was taken out on this home.
Original Mortgage
$265,000
Outstanding Balance
$166,049
Interest Rate
6.02%
Mortgage Type
Purchase Money Mortgage
Estimated Equity
$450,878
Purchase Details
Closed on
Oct 27, 2004
Sold by
Chow Peter V and Chow Rosana P
Bought by
Won Yong M
Home Financials for this Owner
Home Financials are based on the most recent Mortgage that was taken out on this home.
Original Mortgage
$256,000
Interest Rate
5.74%
Mortgage Type
Purchase Money Mortgage
Create a Home Valuation Report for This Property
The Home Valuation Report is an in-depth analysis detailing your home's value as well as a comparison with similar homes in the area
Home Values in the Area
Average Home Value in this Area
Purchase History
| Date | Buyer | Sale Price | Title Company |
|---|---|---|---|
| Beaton Christine | $305,000 | -- | |
| Won Yong M | $320,000 | -- |
Source: Public Records
Mortgage History
| Date | Status | Borrower | Loan Amount |
|---|---|---|---|
| Open | Beaton Christine | $265,000 | |
| Previous Owner | Won Yong M | $256,000 |
Source: Public Records
Property History
| Date | Event | Price | List to Sale | Price per Sq Ft |
|---|---|---|---|---|
| 06/16/2025 06/16/25 | Off Market | $4,400 | -- | -- |
| 05/01/2025 05/01/25 | Price Changed | $4,400 | 0.0% | $0 / Sq Ft |
| 05/01/2025 05/01/25 | For Rent | $4,400 | -2.2% | -- |
| 04/09/2025 04/09/25 | Off Market | $4,500 | -- | -- |
| 02/21/2025 02/21/25 | For Rent | $4,500 | -- | -- |
Tax History Compared to Growth
Tax History
| Year | Tax Paid | Tax Assessment Tax Assessment Total Assessment is a certain percentage of the fair market value that is determined by local assessors to be the total taxable value of land and additions on the property. | Land | Improvement |
|---|---|---|---|---|
| 2025 | $5,137 | $443,600 | $0 | $443,600 |
| 2024 | $4,795 | $439,900 | $0 | $439,900 |
| 2023 | $4,725 | $439,900 | $0 | $439,900 |
| 2022 | $4,515 | $415,000 | $0 | $415,000 |
| 2021 | $4,428 | $415,000 | $0 | $415,000 |
| 2020 | $4,180 | $395,800 | $0 | $395,800 |
| 2019 | $4,091 | $388,100 | $0 | $388,100 |
| 2018 | $3,802 | $362,800 | $0 | $362,800 |
| 2017 | $3,558 | $336,000 | $0 | $336,000 |
| 2016 | $3,391 | $308,300 | $0 | $308,300 |
| 2015 | $3,794 | $313,300 | $0 | $313,300 |
| 2014 | $3,582 | $284,700 | $0 | $284,700 |
Source: Public Records
Map
Nearby Homes
- 178 Brighton Ave Unit 12
- 21 Park Vale Ave Unit 2
- 53 Quint Ave
- 20 Radcliffe Rd Unit 209
- 20 Radcliffe Rd Unit 112
- 14 Radcliffe Rd Unit 1
- 30 Glenville Ave Unit 1
- 5 Spofford Rd Unit 17
- 83 Glenville Ave
- 1 Highgate St
- 4 Franklin St Unit 403
- 8 Franklin St Unit 202
- 8 Franklin St Unit 401
- 30 Penniman Rd Unit 201
- 86 Glenville Ave Unit 2
- 15 N Beacon St Unit 328
- 15 N Beacon St Unit 412
- 15 N Beacon St Unit L01
- 15 N Beacon St Unit 401
- 20 Penniman Rd Unit 208
- 29 Park Vale Ave Unit 4
- 29 Park Vale Ave Unit 6
- 29 Park Vale Ave Unit 3
- 29 Park Vale Ave Unit 2
- 29 Park Vale Ave Unit 1,29
- 29 Park Vale Ave Unit 7
- 29 Park Vale Ave
- 25 Park Vale Ave (2nd Fl) Unit 4, 25
- 37 Park Vale Ave Unit 6
- 37 Park Vale Ave Unit 5
- 37 Park Vale Ave Unit 4
- 37 Park Vale Ave Unit 3
- 37 Park Vale Ave Unit 2
- 37 Park Vale Ave Unit 1
- 37 Park Vale Ave
- 25 Park Vale Ave Unit 4
- 25 Park Vale Ave Unit 6
- 25 Park Vale Ave Unit 5
- 25 Park Vale Ave Unit 3
- 25 Park Vale Ave Unit 1