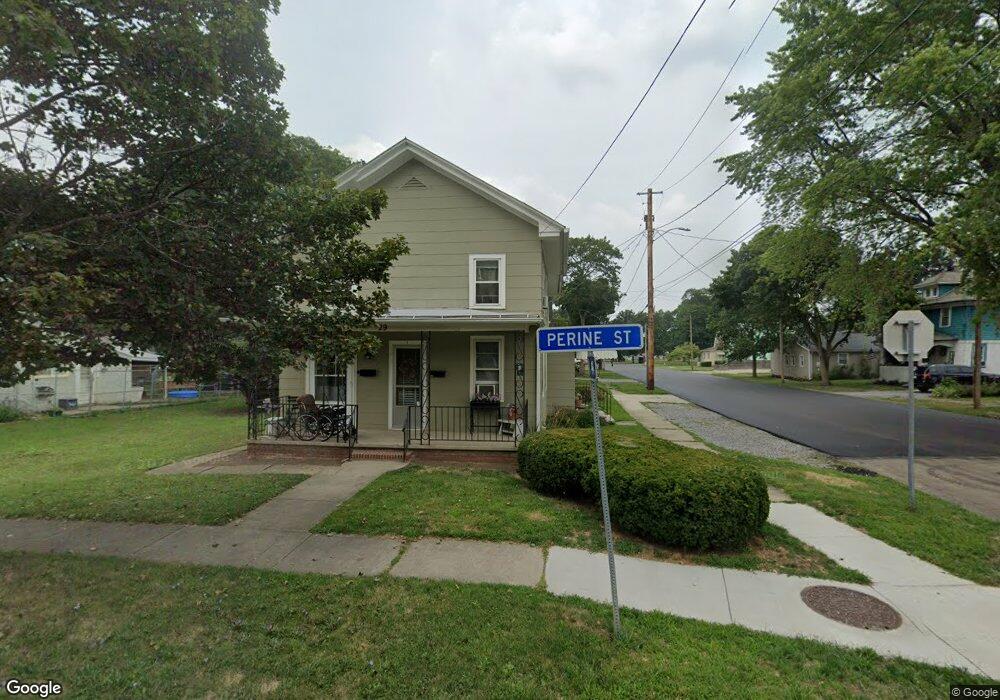
29 Perine St Dansville, NY 14437
Estimated Value: $104,000 - $135,732
4
Beds
2
Baths
1,884
Sq Ft
$64/Sq Ft
Est. Value
About This Home
This home is located at 29 Perine St, Dansville, NY 14437 and is currently estimated at $120,433, approximately $63 per square foot. 29 Perine St is a home located in Livingston County with nearby schools including Dansville Primary School, Ellis B Hyde Elementary School, and Dansville Junior Senior High School.
Ownership History
Date
Name
Owned For
Owner Type
Purchase Details
Closed on
May 14, 2019
Sold by
Brewer Lt
Bought by
Snyder Chad T and Snyder Ryan M
Current Estimated Value
Home Financials for this Owner
Home Financials are based on the most recent Mortgage that was taken out on this home.
Original Mortgage
$54,800
Outstanding Balance
$47,477
Interest Rate
4.2%
Mortgage Type
New Conventional
Estimated Equity
$72,956
Purchase Details
Closed on
Sep 30, 2010
Sold by
Brewer James
Bought by
Brewer James
Purchase Details
Closed on
Dec 21, 2007
Sold by
Blum Michael
Bought by
Brewer James C
Create a Home Valuation Report for This Property
The Home Valuation Report is an in-depth analysis detailing your home's value as well as a comparison with similar homes in the area
Home Values in the Area
Average Home Value in this Area
Purchase History
| Date | Buyer | Sale Price | Title Company |
|---|---|---|---|
| Snyder Chad T | $68,400 | -- | |
| Brewer James | -- | Michael Robinson | |
| Brewer James C | $70,000 | William Higgins |
Source: Public Records
Mortgage History
| Date | Status | Borrower | Loan Amount |
|---|---|---|---|
| Open | Snyder Chad T | $54,800 |
Source: Public Records
Tax History
| Year | Tax Paid | Tax Assessment Tax Assessment Total Assessment is a certain percentage of the fair market value that is determined by local assessors to be the total taxable value of land and additions on the property. | Land | Improvement |
|---|---|---|---|---|
| 2025 | $3,358 | $96,300 | $9,300 | $87,000 |
| 2024 | $3,322 | $96,300 | $9,300 | $87,000 |
| 2023 | $3,318 | $96,300 | $9,300 | $87,000 |
| 2022 | $3,234 | $96,300 | $9,300 | $87,000 |
| 2021 | $3,238 | $81,900 | $9,300 | $72,600 |
| 2020 | $3,282 | $81,900 | $9,300 | $72,600 |
| 2019 | $3,039 | $81,900 | $9,300 | $72,600 |
| 2018 | $3,039 | $80,100 | $9,300 | $70,800 |
| 2017 | $2,927 | $71,900 | $9,300 | $62,600 |
| 2016 | $2,910 | $71,900 | $9,300 | $62,600 |
| 2015 | -- | $71,900 | $9,300 | $62,600 |
| 2014 | -- | $71,900 | $9,300 | $62,600 |
Source: Public Records
Map
Nearby Homes
- 69 Perine St
- 12 Sunnyside Dr
- 20 Health St
- 21 Franklin St
- 117 Main St
- 16 Elizabeth St
- 59 Liberty St
- 40 Clara Barton St
- 10 Elm St
- 55 Franklin St
- 75 Franklin St
- 10212 New York 36
- 16 Adams St
- 0 Gibson St Unit R1517418
- 34 Perrys Way
- 5580 Hartman Rd
- 9125 Culbertson Rd
- 9128 Culbertson Rd
- 9065 Rogers Rd
- 9915 Rowe Rd
Your Personal Tour Guide
Ask me questions while you tour the home.