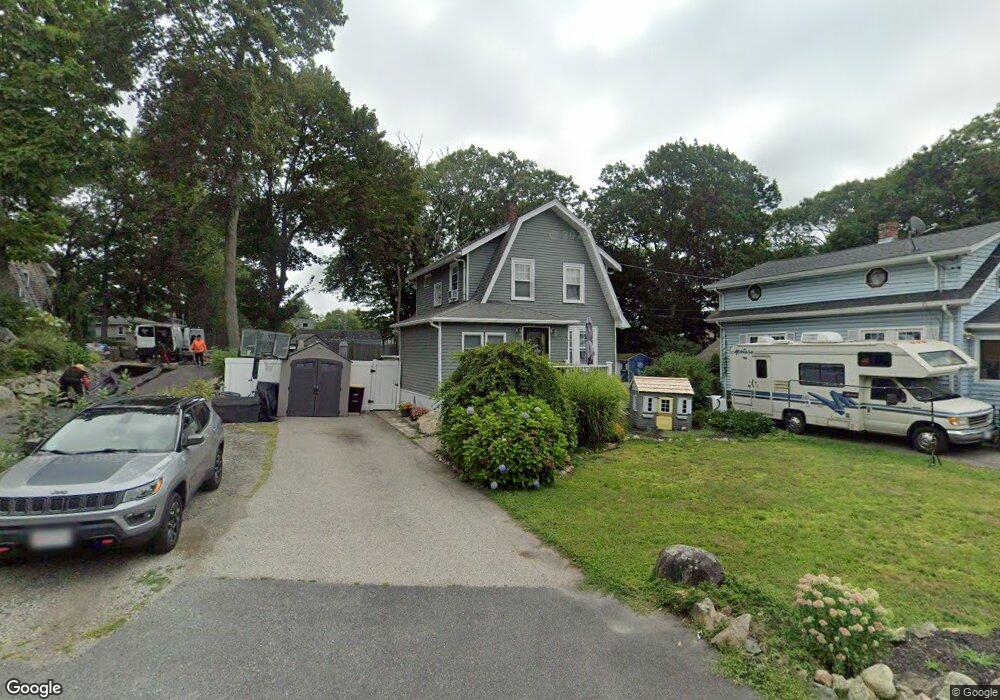
29 Pierce Rd Weymouth, MA 02188
Weymouth Landing NeighborhoodEstimated Value: $533,000 - $588,000
3
Beds
1
Bath
1,286
Sq Ft
$429/Sq Ft
Est. Value
About This Home
This home is located at 29 Pierce Rd, Weymouth, MA 02188 and is currently estimated at $551,768, approximately $429 per square foot. 29 Pierce Rd is a home located in Norfolk County with nearby schools including Abigail Adams Middle School, Frederick C Murphy, and Weymouth Middle School Chapman.
Ownership History
Date
Name
Owned For
Owner Type
Purchase Details
Closed on
Jan 3, 2006
Sold by
J & P Rt
Bought by
Smith Brian E and Smith Heidi J
Current Estimated Value
Home Financials for this Owner
Home Financials are based on the most recent Mortgage that was taken out on this home.
Original Mortgage
$261,000
Outstanding Balance
$147,742
Interest Rate
6.39%
Mortgage Type
Purchase Money Mortgage
Estimated Equity
$404,026
Create a Home Valuation Report for This Property
The Home Valuation Report is an in-depth analysis detailing your home's value as well as a comparison with similar homes in the area
Home Values in the Area
Average Home Value in this Area
Purchase History
| Date | Buyer | Sale Price | Title Company |
|---|---|---|---|
| Smith Brian E | $290,000 | -- |
Source: Public Records
Mortgage History
| Date | Status | Borrower | Loan Amount |
|---|---|---|---|
| Open | Smith Brian E | $261,000 | |
| Closed | Smith Brian E | $14,500 |
Source: Public Records
Tax History Compared to Growth
Tax History
| Year | Tax Paid | Tax Assessment Tax Assessment Total Assessment is a certain percentage of the fair market value that is determined by local assessors to be the total taxable value of land and additions on the property. | Land | Improvement |
|---|---|---|---|---|
| 2025 | $4,920 | $487,100 | $215,100 | $272,000 |
| 2024 | $4,853 | $472,500 | $204,800 | $267,700 |
| 2023 | $4,457 | $426,500 | $189,700 | $236,800 |
| 2022 | $4,355 | $380,000 | $175,600 | $204,400 |
| 2021 | $4,055 | $345,400 | $175,600 | $169,800 |
| 2020 | $3,726 | $312,600 | $175,600 | $137,000 |
| 2019 | $3,636 | $300,000 | $168,900 | $131,100 |
| 2018 | $3,529 | $282,300 | $160,800 | $121,500 |
| 2017 | $3,446 | $269,000 | $153,200 | $115,800 |
| 2016 | $3,311 | $258,700 | $147,300 | $111,400 |
| 2015 | $3,122 | $242,000 | $140,600 | $101,400 |
| 2014 | $2,991 | $224,900 | $130,900 | $94,000 |
Source: Public Records
Map
Nearby Homes
- 19 Vine St Unit 3
- 19 Vine St Unit 1
- 114 Broad St Unit D
- 114 Broad St Unit C
- 11 Richmond St
- 23-25 Lindbergh Ave
- 16 Lindbergh Ave
- 286 Broad St
- 122 Washington St Unit 22
- 12 Klasson Ln
- 294 Commercial St
- 367 Essex St
- 76 Kingman St
- 286 Essex St
- 33 Congress St
- 15 Summer St
- 36 Brookside Rd
- 15 1st St
- 38 Idlewell St
- 42 Sundin Rd