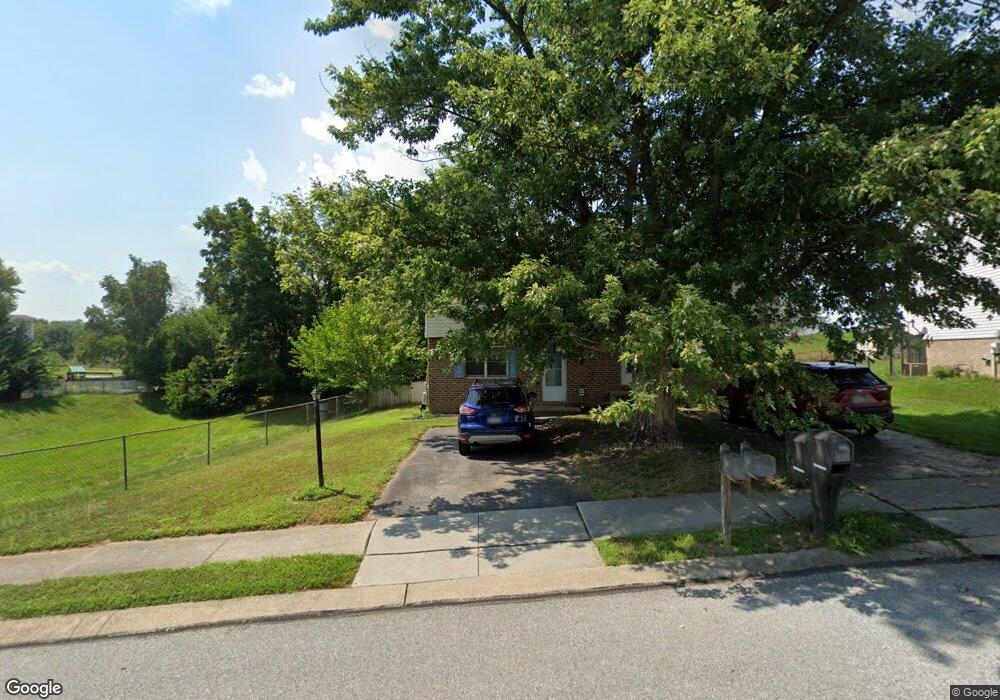
29 Pinewood Cir Hanover, PA 17331
Estimated Value: $167,000 - $245,000
2
Beds
2
Baths
1,218
Sq Ft
$176/Sq Ft
Est. Value
About This Home
This home is located at 29 Pinewood Cir, Hanover, PA 17331 and is currently estimated at $214,024, approximately $175 per square foot. 29 Pinewood Cir is a home located in York County with nearby schools including South Western Senior High School, St Joseph Catholic School, and Hope Christian School Of Hanover.
Ownership History
Date
Name
Owned For
Owner Type
Purchase Details
Closed on
Oct 11, 2013
Sold by
Secretary Of Va
Bought by
Owens Ashley William
Current Estimated Value
Home Financials for this Owner
Home Financials are based on the most recent Mortgage that was taken out on this home.
Original Mortgage
$74,205
Outstanding Balance
$55,889
Interest Rate
4.56%
Mortgage Type
New Conventional
Estimated Equity
$158,135
Purchase Details
Closed on
Sep 11, 2012
Sold by
Goss Ivan L and Chase Home Finance Llc
Bought by
Secretary Of Veterans Affairs
Purchase Details
Closed on
Aug 29, 2008
Sold by
Benton William R
Bought by
Goss Ivan L
Home Financials for this Owner
Home Financials are based on the most recent Mortgage that was taken out on this home.
Original Mortgage
$152,884
Interest Rate
6.69%
Mortgage Type
VA
Create a Home Valuation Report for This Property
The Home Valuation Report is an in-depth analysis detailing your home's value as well as a comparison with similar homes in the area
Home Values in the Area
Average Home Value in this Area
Purchase History
| Date | Buyer | Sale Price | Title Company |
|---|---|---|---|
| Owens Ashley William | $76,500 | None Available | |
| Secretary Of Veterans Affairs | $2,510 | None Available | |
| Goss Ivan L | $148,000 | None Available |
Source: Public Records
Mortgage History
| Date | Status | Borrower | Loan Amount |
|---|---|---|---|
| Open | Owens Ashley William | $74,205 | |
| Previous Owner | Goss Ivan L | $152,884 |
Source: Public Records
Tax History Compared to Growth
Tax History
| Year | Tax Paid | Tax Assessment Tax Assessment Total Assessment is a certain percentage of the fair market value that is determined by local assessors to be the total taxable value of land and additions on the property. | Land | Improvement |
|---|---|---|---|---|
| 2025 | $3,539 | $105,000 | $39,270 | $65,730 |
| 2024 | $3,539 | $105,000 | $39,270 | $65,730 |
| 2023 | $3,476 | $105,000 | $39,270 | $65,730 |
| 2022 | $3,401 | $105,000 | $39,270 | $65,730 |
| 2021 | $3,215 | $105,000 | $39,270 | $65,730 |
| 2020 | $3,215 | $105,000 | $39,270 | $65,730 |
| 2019 | $3,153 | $105,000 | $39,270 | $65,730 |
| 2018 | $3,112 | $105,000 | $39,270 | $65,730 |
| 2017 | $3,040 | $105,000 | $39,270 | $65,730 |
| 2016 | $0 | $105,000 | $39,270 | $65,730 |
| 2015 | -- | $105,000 | $39,270 | $65,730 |
| 2014 | -- | $105,000 | $39,270 | $65,730 |
Source: Public Records
Map
Nearby Homes
- 29 Pinewood Cir
- 31 Pinewood Cir
- 33 Pinewood Cir
- 27 Pinewood Cir
- 25 Pinewood Cir Unit 23
- 25 Pinewood Cir
- 16 Pinewood Cir
- 14 Pinewood Cir
- 35 Pinewood Cir
- 23 Pinewood Cir
- 18 Pinewood Cir
- 37 Pinewood Cir
- 20 Pinewood Cir
- 12 Pinewood Cir
- 39 Pinewood Cir
- 21 Pinewood Cir
- 744 Barrett St
- 748 Barrett St
- 22 Pinewood Cir
- 10 Pinewood Cir