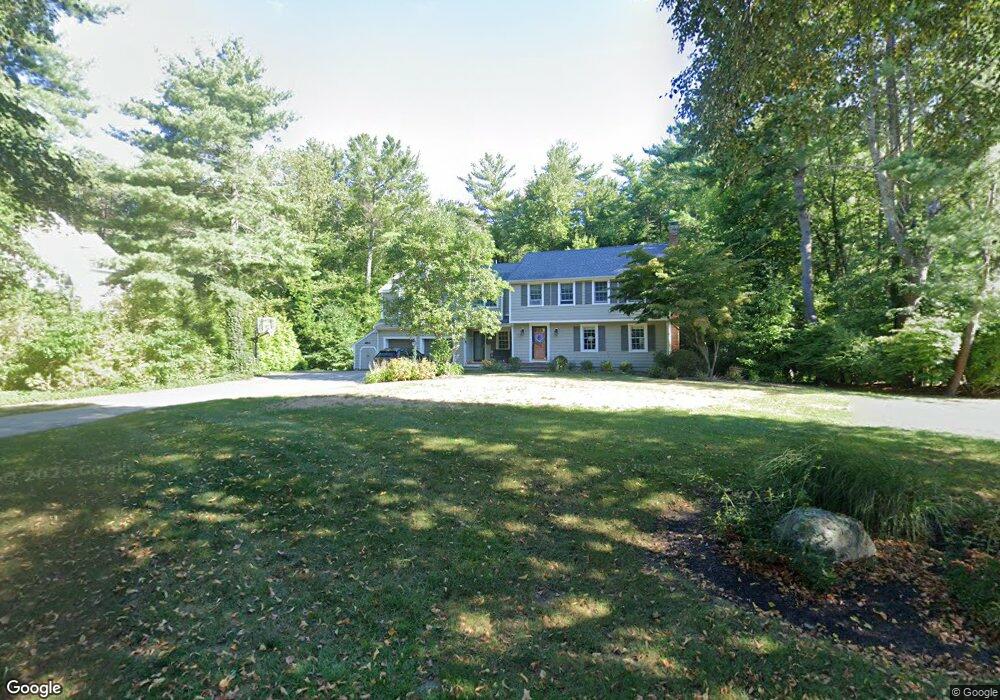
29 Pioneer Rd Hingham, MA 02043
South Hingham NeighborhoodEstimated Value: $1,378,000 - $1,615,000
4
Beds
3
Baths
2,782
Sq Ft
$525/Sq Ft
Est. Value
About This Home
This home is located at 29 Pioneer Rd, Hingham, MA 02043 and is currently estimated at $1,459,590, approximately $524 per square foot. 29 Pioneer Rd is a home located in Plymouth County with nearby schools including South Elementary School, Fusion Academy Hingham, and The Accord School.
Ownership History
Date
Name
Owned For
Owner Type
Purchase Details
Closed on
Mar 11, 2024
Sold by
Driscoll Robert P and Driscoll Cynthia W
Bought by
Driscoll Cynthia W and Driscoll
Current Estimated Value
Purchase Details
Closed on
Aug 27, 1992
Sold by
Johnson Kenneth A and Johnson Diane M
Bought by
Driscoll Robert P and Driscoll Cynthia W
Home Financials for this Owner
Home Financials are based on the most recent Mortgage that was taken out on this home.
Original Mortgage
$202,300
Interest Rate
8.09%
Mortgage Type
Purchase Money Mortgage
Create a Home Valuation Report for This Property
The Home Valuation Report is an in-depth analysis detailing your home's value as well as a comparison with similar homes in the area
Home Values in the Area
Average Home Value in this Area
Purchase History
| Date | Buyer | Sale Price | Title Company |
|---|---|---|---|
| Driscoll Cynthia W | -- | None Available | |
| Pioneer Rd Rt | -- | None Available | |
| Driscoll Cynthia W | -- | None Available | |
| Driscoll Robert P | $290,000 | -- | |
| Driscoll Robert P | $290,000 | -- |
Source: Public Records
Mortgage History
| Date | Status | Borrower | Loan Amount |
|---|---|---|---|
| Previous Owner | Driscoll Robert P | $220,000 | |
| Previous Owner | Driscoll Robert P | $30,000 | |
| Previous Owner | Driscoll Robert P | $202,300 |
Source: Public Records
Tax History Compared to Growth
Tax History
| Year | Tax Paid | Tax Assessment Tax Assessment Total Assessment is a certain percentage of the fair market value that is determined by local assessors to be the total taxable value of land and additions on the property. | Land | Improvement |
|---|---|---|---|---|
| 2025 | $12,476 | $1,167,100 | $493,700 | $673,400 |
| 2024 | $12,037 | $1,109,400 | $493,700 | $615,700 |
| 2023 | $10,548 | $1,054,800 | $493,700 | $561,100 |
| 2022 | $9,943 | $860,100 | $411,400 | $448,700 |
| 2021 | $9,695 | $821,600 | $411,400 | $410,200 |
| 2020 | $9,255 | $802,700 | $411,400 | $391,300 |
| 2019 | $9,192 | $778,300 | $411,400 | $366,900 |
| 2018 | $9,161 | $778,300 | $411,400 | $366,900 |
| 2017 | $8,788 | $717,400 | $411,400 | $306,000 |
| 2016 | $9,862 | $789,600 | $391,700 | $397,900 |
| 2015 | $9,658 | $770,800 | $372,900 | $397,900 |
Source: Public Records
Map
Nearby Homes