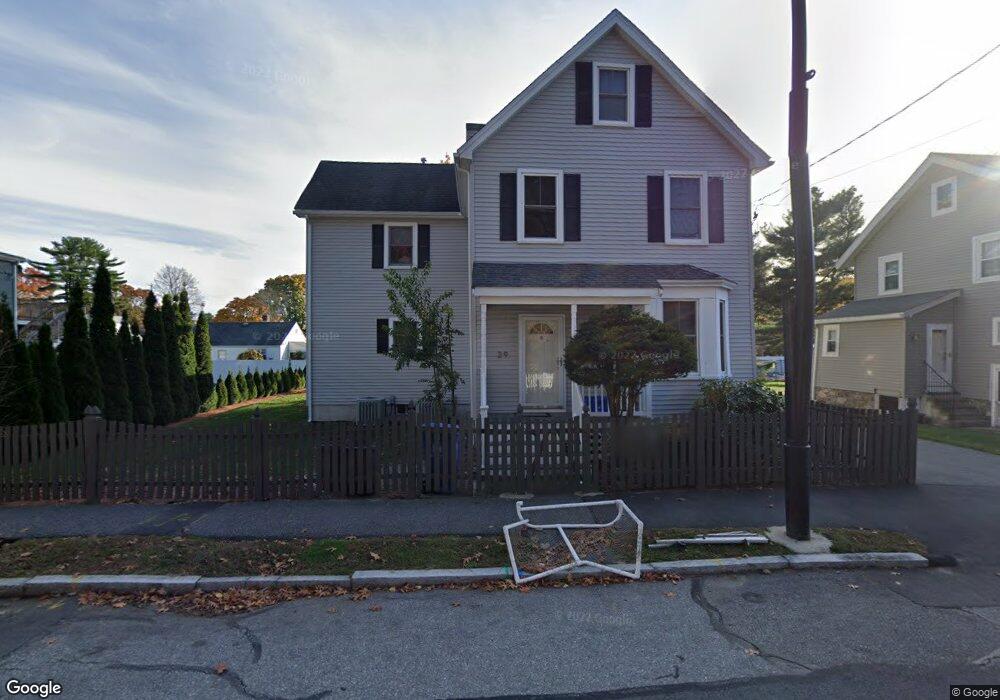
29 Pitman Ave Wakefield, MA 01880
Greenwood NeighborhoodEstimated Value: $889,000 - $996,000
3
Beds
1
Bath
2,570
Sq Ft
$370/Sq Ft
Est. Value
About This Home
This home is located at 29 Pitman Ave, Wakefield, MA 01880 and is currently estimated at $950,279, approximately $369 per square foot. 29 Pitman Ave is a home located in Middlesex County with nearby schools including Wakefield Memorial High School, Melrose Montessori School, and St Mary's School.
Ownership History
Date
Name
Owned For
Owner Type
Purchase Details
Closed on
Feb 28, 1997
Sold by
Maurer Steven R and Maurer Lisa A
Bought by
Sander Martin W and Broderick Julia A
Current Estimated Value
Purchase Details
Closed on
Oct 28, 1993
Sold by
Torraca Paul A and Torraca Mary Y
Bought by
Maurer Steven R and Maurer Lisa A
Create a Home Valuation Report for This Property
The Home Valuation Report is an in-depth analysis detailing your home's value as well as a comparison with similar homes in the area
Home Values in the Area
Average Home Value in this Area
Purchase History
| Date | Buyer | Sale Price | Title Company |
|---|---|---|---|
| Sander Martin W | $205,000 | -- | |
| Maurer Steven R | $189,000 | -- |
Source: Public Records
Mortgage History
| Date | Status | Borrower | Loan Amount |
|---|---|---|---|
| Open | Maurer Steven R | $196,000 | |
| Closed | Maurer Steven R | $45,000 |
Source: Public Records
Tax History
| Year | Tax Paid | Tax Assessment Tax Assessment Total Assessment is a certain percentage of the fair market value that is determined by local assessors to be the total taxable value of land and additions on the property. | Land | Improvement |
|---|---|---|---|---|
| 2025 | $9,587 | $844,700 | $392,500 | $452,200 |
| 2024 | $9,449 | $839,900 | $390,200 | $449,700 |
| 2023 | $8,991 | $766,500 | $355,800 | $410,700 |
| 2022 | $8,608 | $698,700 | $324,100 | $374,600 |
| 2021 | $8,534 | $670,400 | $302,100 | $368,300 |
| 2020 | $8,003 | $626,700 | $282,400 | $344,300 |
| 2019 | $7,645 | $595,900 | $268,500 | $327,400 |
| 2018 | $7,117 | $549,600 | $247,700 | $301,900 |
| 2017 | $6,694 | $513,700 | $231,500 | $282,200 |
| 2016 | $6,732 | $499,000 | $219,000 | $280,000 |
| 2015 | $6,290 | $466,600 | $204,600 | $262,000 |
| 2014 | $5,738 | $449,000 | $196,800 | $252,200 |
Source: Public Records
Map
Nearby Homes
- 7 West St
- 62 Golden Hills Rd
- 9 Ledge St
- 38 Morgan Ave
- 176 Bay State Rd
- 24 Mount Zion Rd
- 98 Boardman Ave
- 15 Belmont Rd
- 129 Greenwood St
- 11 Ludlow Ave
- 34-36 W Highland Ave
- 824 Main St Unit 1
- 9 Lovis Ave
- 12 Lovis Ave
- 23 Ellsworth Ave
- 60 Franklin St Unit 60
- 58 Franklin St Unit 58
- 177 Oak St
- 24 Ellsworth Ave
- 601 Franklin St Unit 2
Your Personal Tour Guide
Ask me questions while you tour the home.