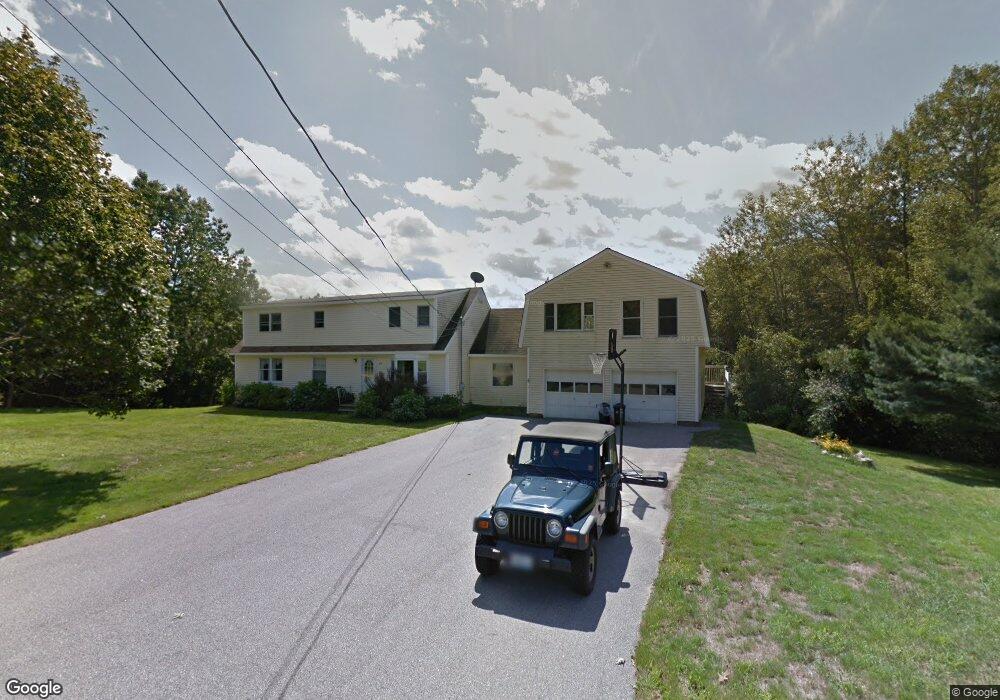
29 Proctor Rd Biddeford, ME 04005
South Biddeford NeighborhoodEstimated Value: $551,000 - $856,000
4
Beds
2
Baths
2,851
Sq Ft
$242/Sq Ft
Est. Value
About This Home
This home is located at 29 Proctor Rd, Biddeford, ME 04005 and is currently estimated at $690,141, approximately $242 per square foot. 29 Proctor Rd is a home located in York County with nearby schools including John F Kennedy Memorial School, Biddeford Primary School, and Biddeford Intermediate School.
Ownership History
Date
Name
Owned For
Owner Type
Purchase Details
Closed on
Jun 29, 2007
Sold by
Dussault Charlotte and Dussault Arthur J
Bought by
Springer Aimee R and Springer Adam C
Current Estimated Value
Home Financials for this Owner
Home Financials are based on the most recent Mortgage that was taken out on this home.
Original Mortgage
$216,000
Outstanding Balance
$129,949
Interest Rate
6.24%
Mortgage Type
Unknown
Estimated Equity
$560,192
Create a Home Valuation Report for This Property
The Home Valuation Report is an in-depth analysis detailing your home's value as well as a comparison with similar homes in the area
Home Values in the Area
Average Home Value in this Area
Purchase History
| Date | Buyer | Sale Price | Title Company |
|---|---|---|---|
| Springer Aimee R | -- | -- |
Source: Public Records
Mortgage History
| Date | Status | Borrower | Loan Amount |
|---|---|---|---|
| Open | Springer Aimee R | $216,000 |
Source: Public Records
Tax History
| Year | Tax Paid | Tax Assessment Tax Assessment Total Assessment is a certain percentage of the fair market value that is determined by local assessors to be the total taxable value of land and additions on the property. | Land | Improvement |
|---|---|---|---|---|
| 2025 | $7,149 | $478,500 | $166,800 | $311,700 |
| 2024 | $6,719 | $472,500 | $166,800 | $305,700 |
| 2023 | $6,199 | $472,500 | $166,800 | $305,700 |
| 2022 | $5,542 | $337,700 | $81,900 | $255,800 |
| 2021 | $5,141 | $282,000 | $68,400 | $213,600 |
| 2020 | $5,067 | $252,700 | $57,900 | $194,800 |
| 2019 | $5,049 | $252,700 | $57,900 | $194,800 |
| 2018 | $4,978 | $252,700 | $57,900 | $194,800 |
| 2017 | $4,929 | $245,600 | $57,900 | $187,700 |
| 2016 | $4,878 | $245,600 | $57,900 | $187,700 |
| 2015 | $4,587 | $245,600 | $57,900 | $187,700 |
| 2014 | $4,474 | $245,600 | $57,900 | $187,700 |
| 2013 | -- | $247,500 | $54,300 | $193,200 |
Source: Public Records
Map
Nearby Homes
- 6 Proctor Rd Unit B
- 6 Proctor Rd Unit A
- 10 Tow Rd
- 109 Proctor Rd
- 5 Moxie Ln
- 0 Cole Benson Rd
- 13 Benson
- 13 Commodore Dr
- 2 Burleigh Ln
- 400 West St
- 74 Guinea Rd
- Lot 10 Jasper Ln
- Lot 4 Jasper Ln
- Lot 3 Jasper Ln
- Lot 12 Jasper Ln
- Lot 2 Jasper Ln
- Lot 9 Jasper Ln
- Lot 11 Jasper Ln
- Lot 5 Jasper Ln
- 9 Jasper Ln
Your Personal Tour Guide
Ask me questions while you tour the home.