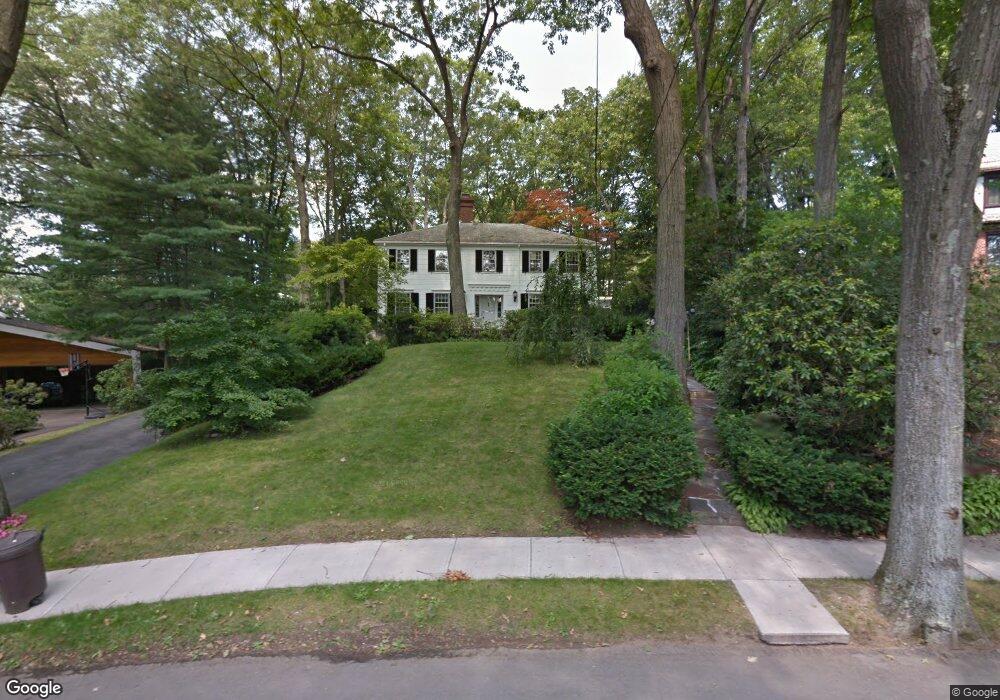
29 Rangeley Rd Chestnut Hill, MA 02467
South Brookline NeighborhoodEstimated Value: $2,180,926 - $2,395,000
4
Beds
4
Baths
2,768
Sq Ft
$827/Sq Ft
Est. Value
About This Home
This home is located at 29 Rangeley Rd, Chestnut Hill, MA 02467 and is currently estimated at $2,288,232, approximately $826 per square foot. 29 Rangeley Rd is a home located in Norfolk County with nearby schools including Baker School, Brookline High School, and Mount Alvernia Academy.
Ownership History
Date
Name
Owned For
Owner Type
Purchase Details
Closed on
Jun 26, 2024
Sold by
Sara Kempner-Stone Ret and Kempner-Stone
Bought by
Phillip J Stone 2010 Ret and Stone
Current Estimated Value
Purchase Details
Closed on
Dec 21, 2015
Sold by
Stone Sara K and Stone Phillip J
Bought by
Sara Kampner & Stone Ret
Purchase Details
Closed on
Sep 29, 2010
Sold by
Stone Phillip J and Stone Sara K
Bought by
Stone Sara K
Create a Home Valuation Report for This Property
The Home Valuation Report is an in-depth analysis detailing your home's value as well as a comparison with similar homes in the area
Home Values in the Area
Average Home Value in this Area
Purchase History
| Date | Buyer | Sale Price | Title Company |
|---|---|---|---|
| Phillip J Stone 2010 Ret | -- | None Available | |
| Phillip J Stone 2010 Ret | -- | None Available | |
| Sara Kampner & Stone Ret | -- | -- | |
| Stone Sara K | -- | -- | |
| Sara Kampner-Stone Ret | -- | -- | |
| Stone Sara K | -- | -- |
Source: Public Records
Tax History
| Year | Tax Paid | Tax Assessment Tax Assessment Total Assessment is a certain percentage of the fair market value that is determined by local assessors to be the total taxable value of land and additions on the property. | Land | Improvement |
|---|---|---|---|---|
| 2025 | $19,171 | $1,942,300 | $1,224,300 | $718,000 |
| 2024 | $18,260 | $1,869,000 | $1,177,200 | $691,800 |
| 2023 | $16,765 | $1,681,500 | $954,600 | $726,900 |
| 2022 | $16,318 | $1,601,400 | $909,100 | $692,300 |
| 2021 | $15,090 | $1,539,800 | $874,100 | $665,700 |
| 2020 | $13,708 | $1,450,600 | $794,600 | $656,000 |
| 2019 | $12,946 | $1,381,600 | $756,800 | $624,800 |
| 2018 | $12,968 | $1,370,800 | $756,700 | $614,100 |
| 2017 | $12,776 | $1,293,100 | $713,700 | $579,400 |
| 2016 | $12,593 | $1,208,500 | $667,000 | $541,500 |
| 2015 | $12,062 | $1,129,400 | $623,400 | $506,000 |
| 2014 | $11,906 | $1,045,300 | $566,700 | $478,600 |
Source: Public Records
Map
Nearby Homes
- 134 Rangeley Rd
- 16 High Rock Terrace
- 66 Brookline St
- 95 Beverly Rd
- 44 Broadlawn Park Unit 22
- 64 Bryon Rd Unit 1
- 50-56 Broadlawn Park Unit 221
- 42 Bryon Rd Unit 6
- 28 Westgate Rd Unit 3
- 60 Bryon Rd Unit 1
- 16 Dorcar Rd
- 66 Bryon Rd Unit 2
- 17 Tirrell Crescent
- 60 Alberta Rd
- 459 Dudley Rd
- 72 Wallis Rd
- 1307 Lagrange St Unit 1307
- 36 Goodnough Rd
- 70 Craftsland Rd
- 29 Clifton Rd
Your Personal Tour Guide
Ask me questions while you tour the home.