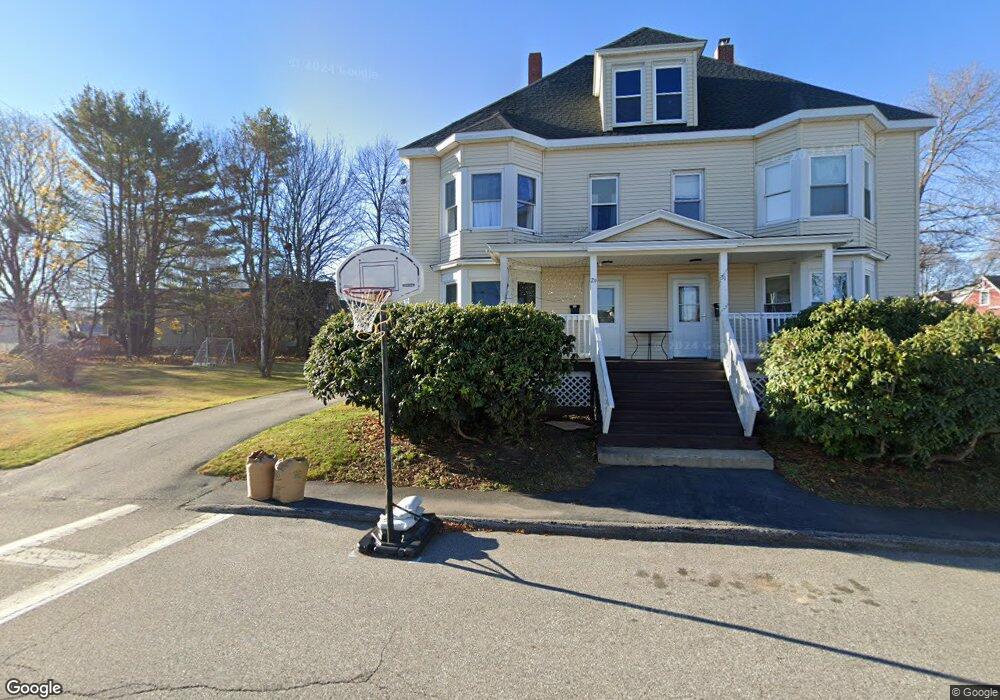
29 Ray St Unit 31 Biddeford, ME 04005
Estimated Value: $536,000 - $611,000
5
Beds
2
Baths
2,772
Sq Ft
$202/Sq Ft
Est. Value
About This Home
This home is located at 29 Ray St Unit 31, Biddeford, ME 04005 and is currently estimated at $559,648, approximately $201 per square foot. 29 Ray St Unit 31 is a home located in York County with nearby schools including John F Kennedy Memorial School, Biddeford Primary School, and Biddeford Intermediate School.
Ownership History
Date
Name
Owned For
Owner Type
Purchase Details
Closed on
Jun 30, 2021
Sold by
Marchand David R
Bought by
Hicks Michelle E
Current Estimated Value
Home Financials for this Owner
Home Financials are based on the most recent Mortgage that was taken out on this home.
Original Mortgage
$262,500
Outstanding Balance
$238,178
Interest Rate
2.9%
Mortgage Type
Purchase Money Mortgage
Estimated Equity
$321,470
Create a Home Valuation Report for This Property
The Home Valuation Report is an in-depth analysis detailing your home's value as well as a comparison with similar homes in the area
Home Values in the Area
Average Home Value in this Area
Purchase History
| Date | Buyer | Sale Price | Title Company |
|---|---|---|---|
| Hicks Michelle E | -- | None Available |
Source: Public Records
Mortgage History
| Date | Status | Borrower | Loan Amount |
|---|---|---|---|
| Open | Hicks Michelle E | $262,500 |
Source: Public Records
Tax History Compared to Growth
Tax History
| Year | Tax Paid | Tax Assessment Tax Assessment Total Assessment is a certain percentage of the fair market value that is determined by local assessors to be the total taxable value of land and additions on the property. | Land | Improvement |
|---|---|---|---|---|
| 2024 | $5,961 | $419,200 | $158,900 | $260,300 |
| 2023 | $5,409 | $412,300 | $156,000 | $256,300 |
| 2022 | $4,729 | $288,200 | $87,800 | $200,400 |
| 2021 | $4,512 | $247,500 | $74,300 | $173,200 |
| 2020 | $4,281 | $213,500 | $67,500 | $146,000 |
| 2019 | $4,266 | $213,500 | $67,500 | $146,000 |
| 2018 | $4,901 | $213,500 | $67,500 | $146,000 |
| 2017 | $5,301 | $207,200 | $67,500 | $139,700 |
| 2016 | $4,115 | $207,200 | $67,500 | $139,700 |
| 2015 | $4,034 | $207,200 | $67,500 | $139,700 |
| 2014 | -- | $207,200 | $67,500 | $139,700 |
| 2013 | -- | $231,200 | $77,000 | $154,200 |
Source: Public Records
Map
Nearby Homes